Geoscience Reference
In-Depth Information
3
60°N
30°
2
0°
°C
30°
1
60°S
0
derived from the scanning multichannel microwave radiometer (SMMR) on board the NASA
Nimbus 7 satellite from 1978 to 1987. From (Yu and P. Gloersen,
2005
), courtesy of Taylor
and Francis.
where A
0
is the seasonal amplitude, o
a
is the angular frequency of the annual cycle and
f is a phase angle. Since Q
i
¼ @
H
T
/
@
t, the corresponding variation in heat storage is:
A
0
o
a
cos
H
T
¼
H
T
þ
H
T
0
cos
ð
o
a
t
þ
d
Þ¼
H
T
ð
o
a
t
þ
d
Þ
ð
2
:
9
Þ
where
H
T
is the mean heat content. By fitting the observed cycle of water column heat
content H
T
to a cosine wave function, H
T0
and hence A
0
may be determined (Bowers
and Simpson,
1990
), providing that the Q
i
dominates over Q
v
. We shall return to the
topic of surface heat exchange in a shelf sea in
Chapter 6
and see how heat storage is
influenced by water column depth and tidal stirring.
2.2.5
Variation of heat fluxes with latitude
Seasonal effects are strongest in the region extending from mid latitudes towards polar
regions. In high latitudes, continuous ice cover acts to inhibit seasonal exchange.
At low latitudes, seasonal influence diminishes until, in equatorial regions, there is
generallyratherlittlechangeinthewatercolumnheatstorageovertheannualcycle.
The heat balance is then maintained on a shorter time scale with daily gains and losses
almost equal and a minimal annual variation in water column heat storage.
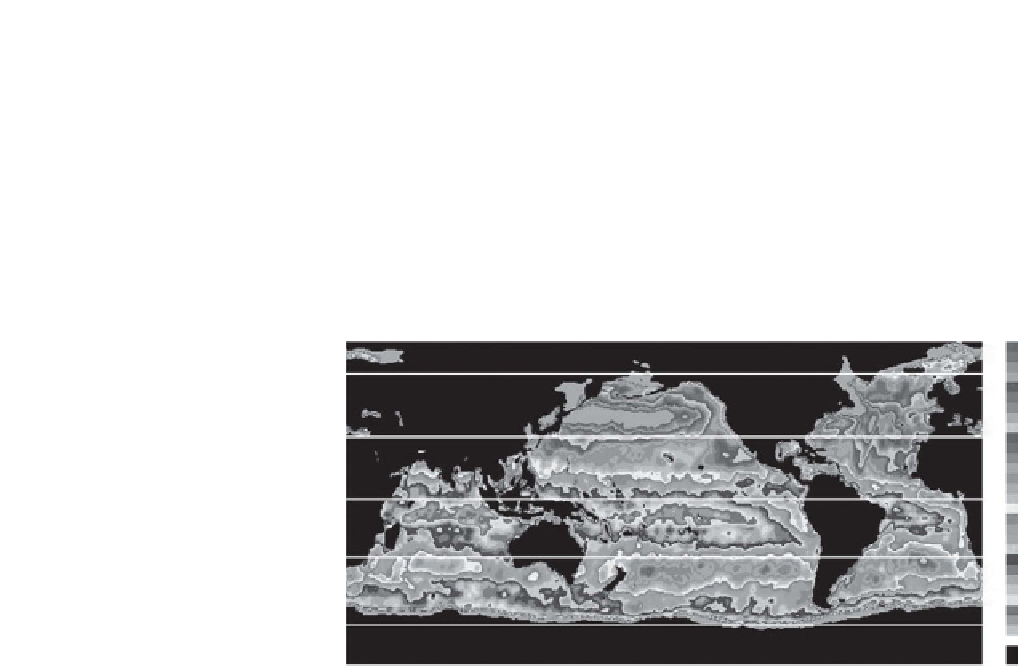
An overview of seasonal thermal changes in the ocean is shown in
Fig. 2.8
(see
colour plates). The amplitude of the annual cycle of surface temperature has been
estimated by fitting a sine wave function to ten years of SST data obtained from
satellite microwave sensors (Yu and Gloersen,
2005
). You can see that the amplitude
exhibits a strong latitude dependence with pronounced maxima in mid latitudes in both
hemispheres at
0.5
Cor
less. There is an interesting difference between the hemispheres with mid-latitude
maxima exceeding 2.5
C in the North Atlantic and North Pacific contrasting with
35-45
N/S and a minimum in the tropics where it falls to
∼
∼


Search WWH ::

Custom Search