Geoscience Reference
In-Depth Information
300
Q
s
(1-
A
)
200
Q
e
100
Q
b
0
Q
c
-100
Q
i
-200
0
50
100
150
Year days
200
250
300
350
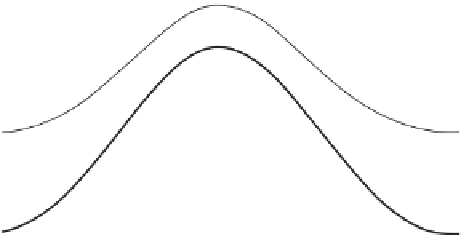
Figure 2.5
Typical pattern of seasonal variation of each of the heat flux terms in temperate
latitudes.
In order to justify the representation of Q
e
and Q
c
by the bulk formulae of
(2.4)
and
(2.5)
and to determine the Dalton and Stanton numbers, it is necessary to make
rigorous measurements of the two fluxes close to the sea surface in what is often a
very energetic and challenging environment. Such measurements are best made a few
metres above the sea surface and require the use of large, stable platforms, such as spar
buoys, which are designed to minimise vertical displacement and maintain vertical
alignment of the spar to which the instruments are attached (e.g. Graber et al.,
2000
).
2.2.4
Seasonal progression of heat fluxes and the heat budget
The separate contributions to the vertical heat flux at the sea surface vary over the
seasonal cycle and combine to determine the net heat flux and hence the heat budget
of the ocean.
Fig. 2.5
illustrates the typical pattern of seasonal variation of each of
the heat flux terms in temperate latitudes. Notice that the heat input is dominated by
the solar heating term Q
s
, which is positive throughout the year with maximum and
minimum inputs at the summer and winter solstices respectively. The net energy loss
by long wave radiation, Q
b
, has a weaker seasonal variation because of the relatively
small proportionate change in the Kelvin temperature of the sea surface. The net
heat flux Q
i
¼
Q
c
is positive during spring and summer, and
negative (net cooling) in autumn and winter
Apart from Q
b
the other large component of heat loss through the sea surface
comes from the evaporation term Q
e
with a smaller contribution from the
transfer of sensible heat Q
c
. Looking at the example in
Fig. 2.5
,youcansee
that Q
c
may change sign to become a heat gain for a period during the summer
when air temperatures exceed SST. The two terms Q
e
and Q
c
tend to follow a
similar seasonal pattern with larger values in the winter months when winds are
generally stronger. This contrasts with Q
b
which has a maximum in summer
when SST is high and cloud cover is reduced. All three of the heat loss rates
vary somewhat even in a particular shelf sea since they depend on SST, which as
Q
s
(1
A)
Q
b
Q
e


Search WWH ::

Custom Search