Geoscience Reference
In-Depth Information
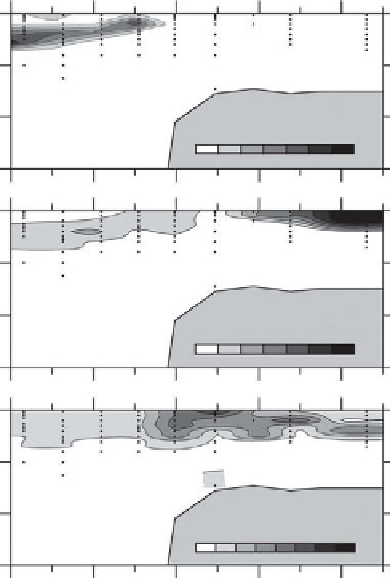
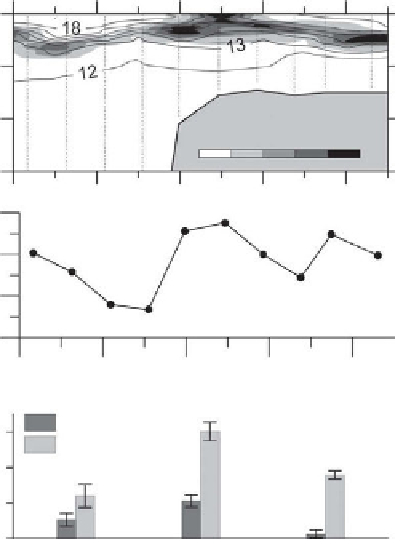
Figure 10.25
Observations of
the phytoplankton community
across the shelf edge of the Celtic
Sea. (a) Temperature (line
contours) and chlorophyll a
(shaded). Vertical lines mark the
positions of the CTD profiles; the
shelf edge is at latitude 48.2
N; (b)
Depth-integrated chlorophyll a
within the upper 100 metres along
the section; (c) The proportion of
phytoplankton carbon within the
diatoms, and the proportion of
chlorophyll a in cells of size
greater than 5
m
m, from samples
collected through the upper
100 metres at the two ends of
the CTD section and at the
shelf edge; (d)-(f) Distributions of
the cyanobacterium
Prochlorococcus, the
cyanobacterium Synechococcus,
and picoeukaryotes. In (d), (e) and
(f) the dots mark the positions of
the water samples used in the flow
cytometer analysis. Adapted from
Sharples et al. (
2009
), courtesy of
the American Geophysical Union.
(a)
0
-100
mg m
-3
-200
0
0.6
1.2
-300
(b)
47.8
48.6
48
48.2
Latitude°N
48.4
(c)
Diatom carbon
chl >5
μ
m
0.6
0.4
0.2
0
Northeast
Atlantic
Shelf
edge
Celtic
Sea
(d)
0
-100
x10
4
cells ml
-1
2
-200
0
1
3
-300
(e)
0
-100
x10
4
cells ml
-1
8
-200
0
4
12
-300
(f)
0
-100
-200
x10
4
cells ml
-1
1
0
2
3
-300
47.8
48
48.2
48.4
48.6
Latitude °N


Search WWH ::

Custom Search