Geoscience Reference
In-Depth Information
(a)
0
300
100
175
O
2
mmol m
-3
50
200
(b)
0
50
100
25
POC
mmol m
-3
0
200
125º00
W
124º40
W
124º20
W
Longitude
(c)
0
0
ml l
-1
120
110
7
6
%
5
50
3
50
50
2
100
100
JFM
A
M
JJ
ASONDJ
Month
J
FM
A
M
J
J
A S O N DJ
Month
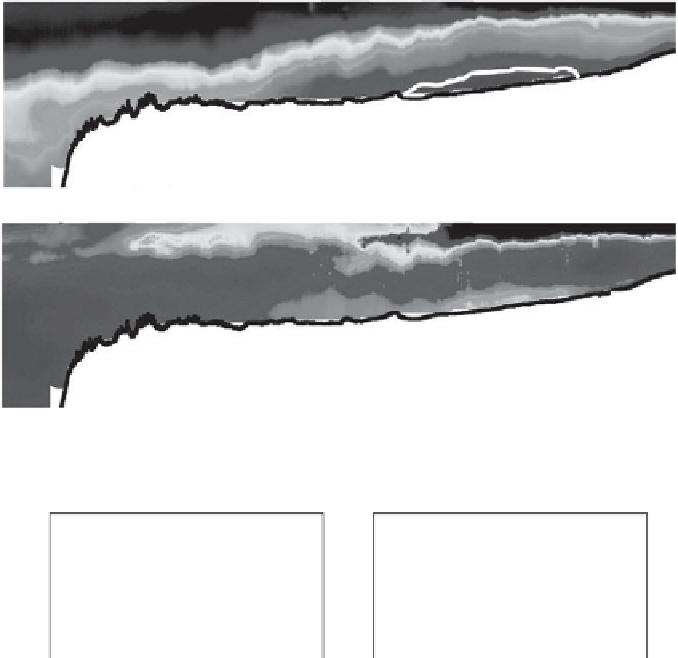
Figure 10.21
See
colour plates version
of (a) and (b). (a) Transect of dissolved oxygen
concentration across the shelf and shelf edge off Oregon. The bold white contour line marks
the extent of hypoxic bottom water; (b) Transect of particulate organic carbon (POC) across
the Oregon shelf and shelf edge; (c) Annual cycle of the dissolved oxygen concentration (left)
and % saturation (right) on the Washington shelf. (a) and (b) are high resolution observations
collected in May 2001 during a period of upwelling-favourable winds. After Hales et al.,
2006
,
courtesy of the American Geophysical Union. (c) is adapted from Landry et al. (
1989
), with
permission from Elsevier.
surface water achieves super-saturated D.O. conditions in summer, due to enhanced
primary production in response to the upwelling of nutrients. Below the productive
surface layer the oxygen concentration becomes hypoxic (D.O. saturation between
1% and 30%). While upwelling of deep water from off the shelf edge can introduce
water with low oxygen concentrations, the hypoxia in the bottom waters of
the California upwelling system in summer is attributed to the decay of organic
carbon previously fixed in response to nutrients supplied by upwelling (Connolly
et al.,
2010
).


Search WWH ::

Custom Search