Geoscience Reference
In-Depth Information
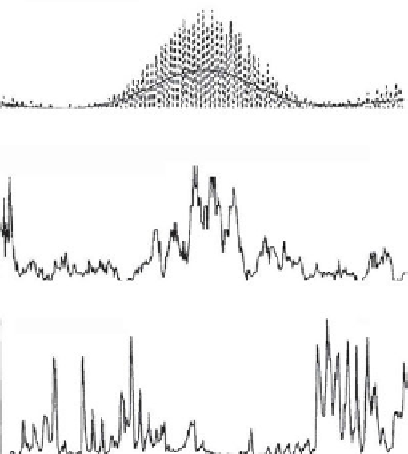
Figure 9.10
Time series of
mixing contributions and
stratification in the Rhine ROFI
Adapted from Souza and
Elsevier. (a) Depth-mean tidal
stirring power (dashed line is
instantaneous, solid line is
tidally averaged) from a
mooring in the Rhine ROFI.
(b) Wind stirring power during
the mooring deployment.
(c) The bottom-surface density
difference measured by the
mooring at the position shown
in Fig. 9.5.
(a)
30
20
10
270
275
280
285
290
(b)
3
2
1
270
275
280
285
290
(c)
8
4
0
270
275
280
285
290
Time (Julian days)
stress. Stratification again tends to vary with the springs-neaps cycle in the tides, but
episodes of wind stirring also make a substantial contribution to vertical mixing. In
Fig
9.10
you can see how vigorous tidal stirring at a spring tide can be reinforced by
an episode of wind stirring, together resulting in virtually complete vertical mixing
following spring tides (e.g. see the reduction in stratification shown in
Fig. 9.10c
around the spring tide at day 279). By contrast, following neaps, the water column
becomes stratified with a bottom-surface density difference
5kgm
3
at times. It is
also clear that there is a strong semi-diurnal periodicity evident in
Fig. 9.10c
. The
obvious mechanism behind this semi-diurnal periodic stratification is again tidal
straining. But how does the straining operate if the major axis of the tidal flow is
parallel to the coast, i.e. orthogonal to the horizontal density gradient?
The normally weak cross-shore tidal shear must be enhanced during periods of
stratification. In order to understand how this occurs, we need to recognise how the
form of the tidal ellipse responds to changes in water column stability (Visser et al.,
takes the form of a Kelvin wave travelling to the north-east along the coast. In
Fig. 9.11a
, measurements made by HF radar show that when the water column is
well-mixed, the tidal ellipses are close to being degenerate (i.e. rectilinear); current
meter data in the region indicate that this is the case at all depths. Conversely,
Fig. 9.11b
, corresponding to the stratified, low mixing period around neap tides,
shows that the surface tidal ellipses become more circular with the current vector
>


Search WWH ::

Custom Search