Geoscience Reference
In-Depth Information
(a)
30
20
10
0
(b)
30
20
10
0
W m
−
3
(c)
10
−
2
30
24.6
10
−
3
20
10
−
4
10
10
−
5
24.6
0
2000
0000
0400
0800
1600
1200
Time (UTC) 5th-6th July 1999
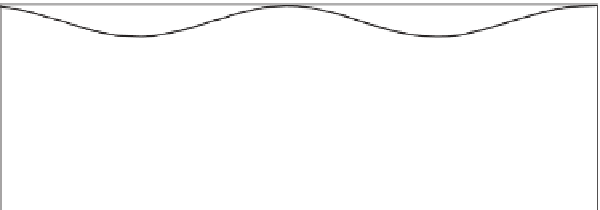
Figure 9.9
See
colour plates version
of (c). Two tidal cycles of (a) temperature, (b) salinity,
and (c) s
t
(kg m
3
, lines) and turbulent dissipation (W m
3
, shaded) measured from a vessel
anchored in Liverpool Bay. The vessel position was the same as that of the mooring data
in
Fig. 9.7
. Adapted from Rippeth et al.,
2001
, with permission from the American
Meteorological Society.
along the Dutch coast is dominated by a progressive Kelvin wave, in which the
velocity is in phase with the elevation, i.e. maximum flow to the north-east occurs
close to high water. This is the opposite of what we have seen in the standing wave
regime of Liverpool Bay, where slack water coincides with HW since the velocity is
∼
90
out of phase with elevation. It also means that in the Rhine ROFI, the major
axis of the tidal current ellipse is aligned with the coast, orthogonal to the horizontal
density gradient; we might think that this should reduce any potential for tidal
straining as the dominant tidal shear is in the wrong direction.
As in Liverpool Bay, there is a continuous competition in the Rhine ROFI between
the stratifying influence of freshwater and the stirring effects of tidal flow and wind


Search WWH ::

Custom Search