Geoscience Reference
In-Depth Information
v (m s
-1
)
u (m s
-1
)
(a)
0.0
0.1
0.2
0.0
0.1
0.2
16
16
12
12
8
4
4
0
0
(b)
35
34
33
>35
31
<31
52°15
N
0.1 m
s
-1
52°N
Rhine
4°E
4° 30
E
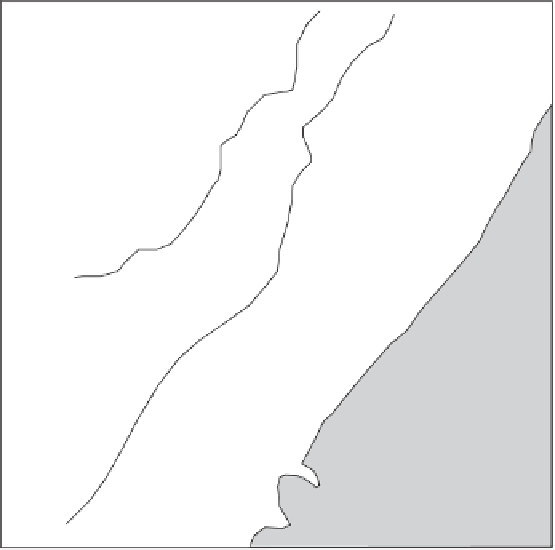
Figure 9.5
(a) The Heaps solution applied to the Rhine ROFI. The open circles represent
long-term average current profiles versus height above bed (m), measured by an ADCP
moored close to the seabed. The dashed lines are the prediction of the Heaps solution with
N
z
¼
2.5
10
3
m
2
s
1
. The ADCP was situated at the position marked
p
in (b). (b) Surface
flow in the Rhine ROFI, measured by HF radar and averaged over 16 days, after Souza et al.,
show the
positions of the radar antennae. The position marked
▲
is that of a mooring used to collect the
data shown in
Fig. 9.11
.


Search WWH ::

Custom Search