Geoscience Reference
In-Depth Information
(a)
0
-20
250
-40
-60
200
-80
2.5
3.0
3.5
4.0
SH
150
(b)
4.0
100
3.5
50
3.0
0
2.5
100
150
200
250
300
350
Julian day
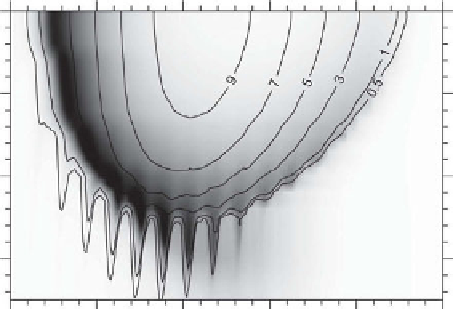
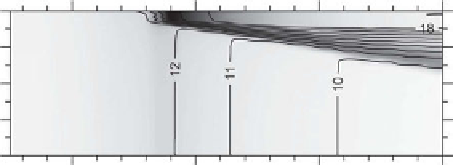
Figure 8.16
See
colour plates version
. Model predictions of (a) cross-frontal temperature
(
C, line contours) and phytoplankton carbon (shaded), and (b) variations in stratification
(surface-bottom temperature difference,
C, line contours) and surface phytoplankton carbon
(shaded) between mid April and late November for different SH. In (a) only the M
2
tide
was operating, so that phytoplankton within the front could only grow in response to changes
in the vertical flux of nitrate at the front. In (b) both M
2
and S
2
tides operated to drive a
spring-neap cycle in mixing. Adapted from Sharples,
2008
, with permission from Oxford
University Press.
proposed as a mechanism with the potential to raise annual productivity in
frontal regions by 70%, compared to a front driven solely by the M
2
tide
(Sharples,
2008
).
The fact that this enhancement occurs within a narrow region at the frontal
boundary has important implications for the horizontal resolution of shelf sea
numerical models. There is some limited evidence from the western Irish Sea
that such spring-neap frontal biomass pulses do indeed occur throughout
summer (Richardson et al.,
1985
). Further evidence for a spring-neap
cycle comes from the Ushant front off northwest France, where estimates of
spring-neap changes in the supply of nitrate to frontal waters have been shown
to be consistent with changes in rates of phytoplankton nitrate uptake (Morin
et al.,
1993
).


Search WWH ::

Custom Search