Geoscience Reference
In-Depth Information
Distance (km)
60
40
20
0
-40
-80
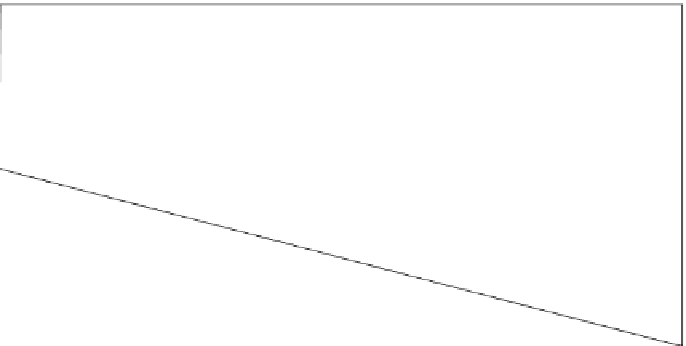
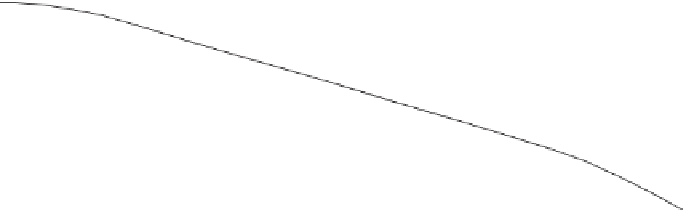
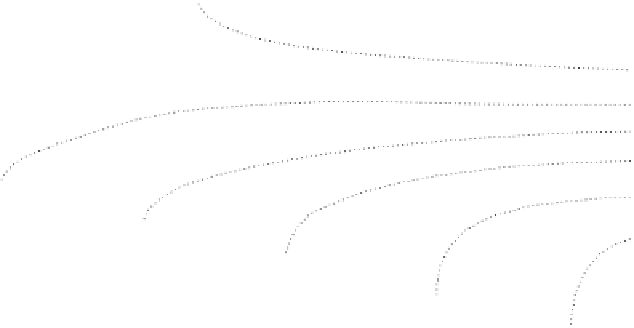
Figure 8.10
Section normal to a front, from a numerical model showing density contours
(dotted lines) and streamlines (continuous and dashed lines) of transverse flow. Numbers on
streamlines are the stream function in units of 10
2
m
2
s
1
. Transverse velocity in the midwater
downward flow does not exceed 1 cm s
1
. From (Garrett and Loder,
1981
) with permission
from the Royal Society, London.
Physics summary box
Tidal mixing fronts mark the transition point between regions that seasonally
stratify and those that remain mixed. They are clearly seen in satellite images of sea
surface temperature as places where surface temperature changes very rapidly.
Where the tides provide the dominant source of mixing, the position of the fronts is
well represented by a critical value of h/u
3
,withh the water depth and u some
measure of the strength of the tidal currents.
Fronts change position due to advection by the tidal currents, and to changes in
the amount of tidal mixing energy available over the spring-neap cycle. The former
is a bulk movement of the front with the flow of water. The latter is an adjustment
of the front's position, typically by 2-4 km, where the water within the region of
the adjustment undergoes a fortnightly cycle in stratification and mixing.
The mean flows associated with the front are illustrated in
Fig. 8.11
. Fronts are
marked by a strong jet-like current. Looking from the stratified region toward the
mixed region, this jet usually flows along the front to the left (northern
hemisphere).
Meanders in this along-front jet can become unstable, pinching off eddies
which transfer water and its constituents across the front.
Friction induces weak flows perpendicular to the front which involve a
convergence of surface currents and a downwelling at the front. The convergence is
often marked by a line of buoyant surface detritus along the edge of the front.


Search WWH ::

Custom Search