Geoscience Reference
In-Depth Information
(a)
-10
-30
-50
-70
06:00
09:00
12:00
15:00
18:00
(b)
1200
E m
-2
s
-1
A: 30
B: 0.5
C: 129
μ
800
400
0
06:00
09:00
12:00
15:00
18:00
Time of day
(c)
0.6
0.4
Mean radiation
0.2
0
0
40
80
120
160
200
240
PAR (
μ
E m
-2
s
-1
)
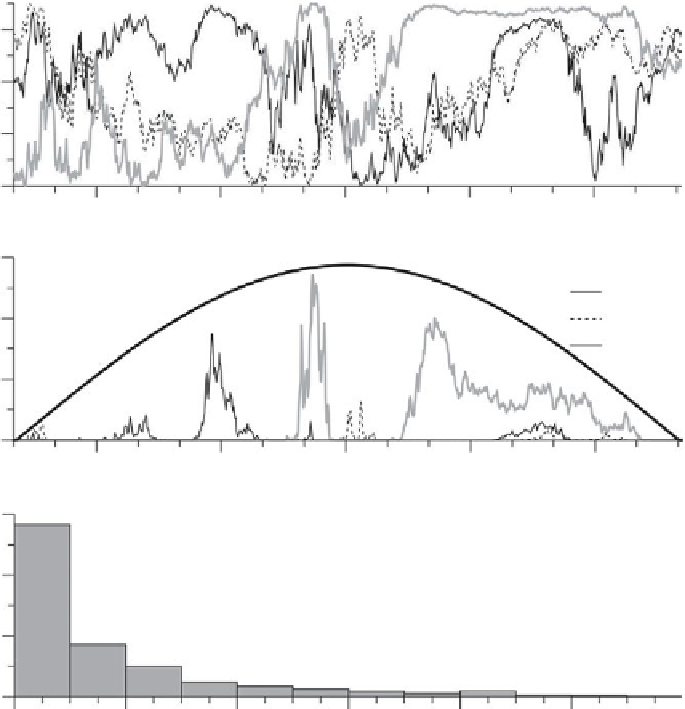
Figure 6.15
The light experienced by different phytoplankton cells as they are mixed
through a homogeneous water column (depth
¼
70m, tidal current amplitude
¼
0.8 m s
1
,
K
PAR
¼
0.3 m
1
). (a) Trajectories of 3 phytoplankton cells during daylight; (b) The light
experienced by the cells as they follow the trajectories in (a). The bold line is the surface
incident PAR and the legend notes the average irradiances experienced by the cells during
daylight hours (mean
¼
729
m
Em
2
s
1
over daylight hours). (c) Distribution of the average
light received by 1000 phytoplankton cells during daylight hours. The predicted depth- and
time-averaged irradiance is marked by the arrow. The data are based on a Lagrangian model
of neutrally buoyant cell trajectories (Ross and Sharples,
2004
), courtesy of Oliver Ross
(Institut de Cie` ncies del Mar de Barcelona). The depth- and tidally averaged vertical eddy
diffusivity was 0.08 m
2
s
1
.
being mixed through a turbulent water column, using a Lagrangian model to track
the cell trajectories. The average light received by the population of cells is what we
would expect if we calculated mean light over the exponential light profile. However,
individual cells within the population experience dramatically different
light


Search WWH ::

Custom Search