Geoscience Reference
In-Depth Information
(a)
10
9
8
7
6
April 7
April 14
April 21
April 28
May 5
May 12
(b)
5
4
3
2
1
0
April 7
April 14
April 21
April 28
May 5
May 12
Date 1989
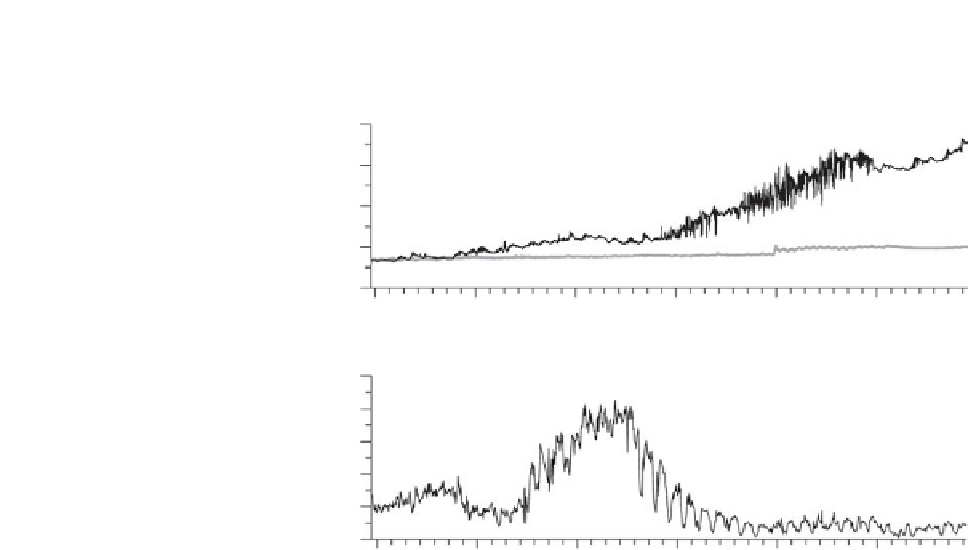
Figure 6.10
Time series illustrating (a) the surface (black line) and near-bed (grey line)
temperature and (b) the surface chlorophyll over the spring bloom in the central North Sea.
Stratification begins to be established from about April 13, with a surface-bed temperature
difference of 0.5
C occurring about April 21. The bloom begins on about April 16-17 when
the surface-bed temperature difference is only 0.2-0.3
C. Data were recorded during the
United Kingdom's North Sea Project (see
http://www.bodc.ac.uk/projects/uk/north_sea/
)by
instruments moored in a depth of 85 metres in the central North Sea.
14
C incubation experiments, a carbon fixation rate of 1.4 g C m
2
d
1
has been
reported for the shelf edge of the Celtic Sea (Rees et al.,
1999
), and a rate of 0.5 g
Cm
2
h
1
(6 g C m
2
d
1
if we assume 12 hours daylight and ignore nighttime
losses) measured in the western English Channel (Pingree et al.,
1976
). This spring
bloom primary production is new production with a high f-ratio (see
Section 5.2.1
).
A simple stoichiometric approach based on the Redfield ratios (
Section 5.1.6
) can
allow us to estimate maximum potential growth rates during a spring bloom (see
Problem 6.6 at the end of this chapter).
6.3.2
Phytoplankton species during the spring bloom
Spring blooms tend to be dominated by large cells (Pingree et al.,
1976
; Joint et al.,
1986
), mainly diatoms (Flagg et al.,
1994
; Mills et al.,
1994
; Townsend and
the region, and they felt sure that spring blooms predicted by the model were artefacts of the modelling
process. The subsequent comparison between the model results and 7 years of cruise observations
demonstrated that it was very likely that every spring cruise to the region had simply missed the
short-lived bloom period (Hadfield and Sharples,
1996
).


Search WWH ::

Custom Search