Geoscience Reference
In-Depth Information
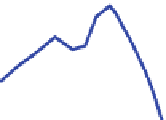
Fig. 2.3
Total desert aerosol
and mineral dust size
distributions for two different
situations in northwestern
Africa (PM
10
inlet);
1
dust
size distribution inferred from
spectral absorption
measurements (“period 1” of
Müller et al.
2009
);
2
inferred
from hygroscopic growth
measurements (“dust event”
of Kaaden et al.
2009
)
10
4
dust
1
total
1
dust
2
total
2
10
3
10
2
10
1
10
0
10
-1
10
-2
10
-1
10
0
10
1
particle diameter, µm
Thus, the lower end of the mineral dust size distribution is often set at 100 nm.
However, even considerably smaller mineral dust particles have been identified
in desert aerosol (Lieke et al.
2011
) in low concentrations.
2.5
Discussion and Conclusions
The uplift, transport, and final deposition of mineral dust from the major source
regions in northern Africa and eastern Asia have severe environmental and climatic
impacts, depending on various physicochemical parameters such as composition,
mixing state, or size and shape of the dust particles. In the following, first, the
possibilities for an assignment of mineral dust samples to specific source regions
are given. Afterwards, the specific physicochemical parameters, which are important
for the evaluation of the impacts of mineral dust on Earth's climate, and different
ecosystems are briefly discussed.
The uplift or entrainment of mineral dust in northern Africa and eastern Asia is
restricted to several main regions, which can cover sometimes areas of thousands of
have been determined by vastly differing methods including personal meteorolog-
ical observations, backward trajectory analyses, remote sensing data, and last but
not least by the use of compositional fingerprints. Only the last method is able to
attribute paleo-dust samples (e.g., from terrestrial or marine surface sediments or


Search WWH ::

Custom Search