Geoscience Reference
In-Depth Information
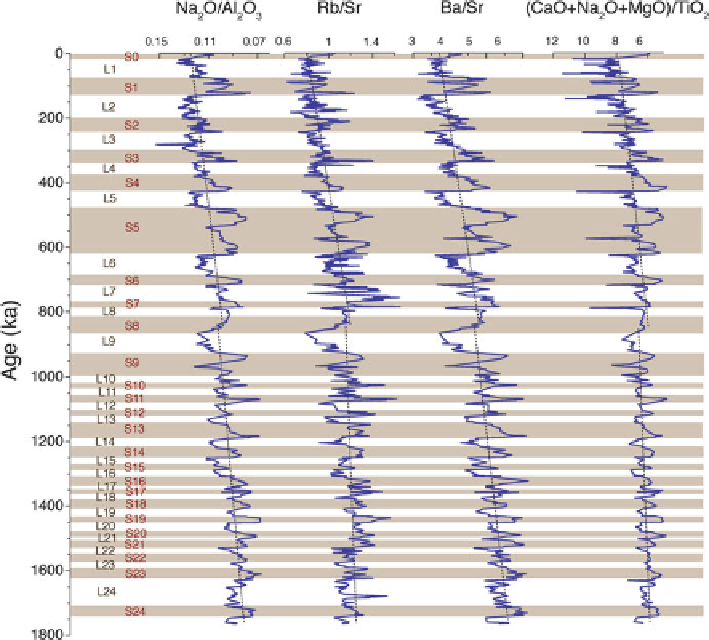
Fig. 16.8
Changes in Na
2
O/Al
2
O
3
(weight-percent ratio, not molar ratio), Rb/Sr, Ba/Sr, and
(CaO
MgO)/TiO
2
(weight-percent ratio, not molar ratio) at loess-paleosol section at
Chashmanigar, Tajikistan. The timescale is taken from Ding et al. (
2002b
). The
shaded zones
indicate interglacials, as represented by paleosols. Greater alteration of weatherable minerals
in paleosols can be seen in these plots (note reversed horizontal scales on Na
2
O/Al
2
O
3
and
(CaO
C
Na
2
O
C
MgO)/TiO
2
plots). The
dashed lines
are linear fits of each curve for different
time intervals (Redrawn from data in Yang et al. (
2006
))
C
Na
2
O
C
grain size, and color reflectance time series all show astronomical periodicities
during the Pleistocene. The mid-Pleistocene climate transition, characterized by
a shift of dominant climatic periods from 41 to 100 kyr at about 1.0-0.8 Ma, is
clearly documented in these proxy records (Ding et al.
2002a
). It is suggested that
alternations of loess and soil horizons in Central Asia were controlled by global
ice volume variations. The long-term chemical weathering history of this section
(Fig.
16.8
) indicates a decreasing chemical weathering trend since 0.85 Ma (Yang
et al.
2006
). This event may be causally related to the expansion of Northern
Hemisphere ice and/or the regional tectonic uplift of high mountains in Asia since
the mid-Pleistocene.
Search WWH ::

Custom Search