Geoscience Reference
In-Depth Information
a
b
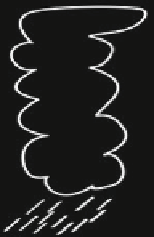
Fig. 13.8
(
a
) A direct circulation with overturning M is perturbed by aerosol radiative forcing
at TOA (F
T
<0) and the surface (F
S
<0) with atmospheric absorption (F
T
F
S
>0). (
b
)
At equilibrium, the surface forcing is balanced by the net heat flux anomaly (F
S
D
ıH
S
<0),
but the TOA forcing is incompletely compensated within the convecting region since some of the
compensating OLR occurs within the descending branch of the circulation. Thus, the net radiative
flux anomaly at the tropopause is negative within the convecting region [ıR
c
.
z
T
/<0] and positive
within the descending branch [ıR
d
.
z
T
/>0], such that the sum of the flux anomalies is zero over
the extent of the circulation. This regional contrast of the flux anomalies requires an anomalous
convergence of energy into the convecting column, even though F
T
F
S
>0. Chou et al. (
2005
)
assume that this convergence results from a slowing of the circulation (ıM < 0). The weaker
circulation (ıM < 0) imports less moisture into the base of the convecting region, so precipitation
is reduced (ıP
c
<0). This analysis neglects changes in moisture import by the mean circulation
transporting the specific humidity anomaly. The quantities q
S;d
and q
T;c
are the specific humidity
of air entering the convecting region from the surface of the descending branch and air leaving at
the tropopause, respectively
forcing reduces precipitation by decreasing the export of energy but also the import
of moisture, as illustrated schematically by Fig.
13.8
.
This argument accounts for gross differences among model precipitation anoma-
lies within the Sahel during NH summer, as summarized in Table
13.2
. Models with
negative TOA forcing over West Africa generally show a reduction of precipitation
(Yoshioka et al.
2007
). In contrast, precipitation increases in models with positive
F
T
(cf. Fig.
13.7
b, c along with Miller et al.
2004b
; Yue et al.
2011
).
However, the relation between model forcing and regional anomalies of pre-
cipitation illustrated by Fig.
13.8
depends upon certain simplifications that are not
always appropriate for dust. First, significant TOA forcing during NH summer


Search WWH ::

Custom Search