Geoscience Reference
In-Depth Information
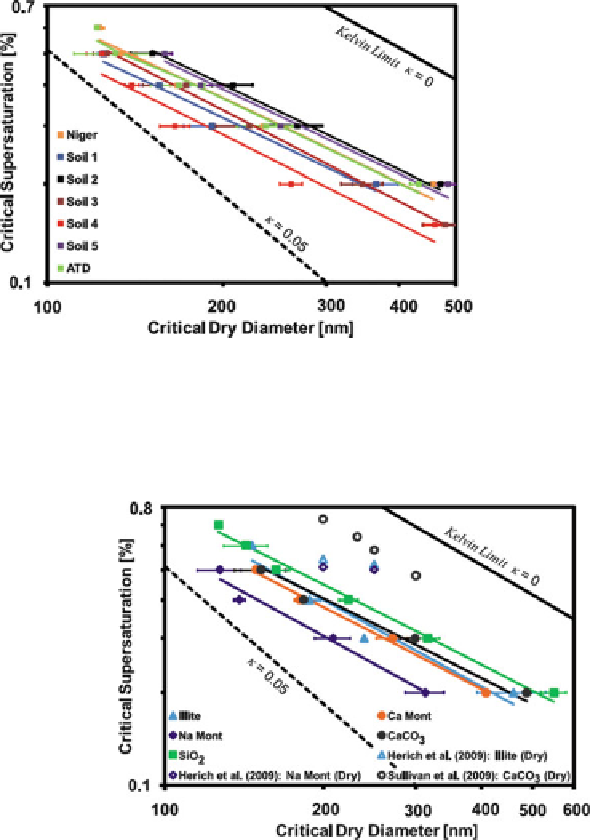
Fig. 12.1
CCN activation curves for different dust types as presented in Kumar et al. (
2011a
).
CCN activation curves for different dust types presented in Table 1 of Kumar et al. (
2011a
).
Symbols show experimentally determined CCN activity and lines show FHH adsorption activation
fits.
Error bars
represent measurement uncertainty in the dry diameter measurement. Also shown
in
black thick line
is the D 0, Kelvin curve.
Black dashed line
corresponds to D 0.05
Fig. 12.2
Similar to
Fig.
12.1
,butfor
dry-generated minerals from
the Kumar et al. (
2011a
)
study. Also shown are data
from the Herich et al. (
2009
)
and Sullivan et al. (
2009a
)
studies
1.2 indicates the dominance of the water vapor adsorption effect
(hence, FHH-AT applies) (Kumar et al.
2011b
).
Using this approach, Kumar et al. (
2011a
) showed that dry-generated dusts from
a wide variety of soils tend to follow FHH-AT, and not ›-KT (Fig.
12.1
); the same
study also showed that aerosol generated from pure minerals also followed the
same trend (Fig.
12.2
). Kumar et al. (
2011a
) also suggest that one set of FHH-AT
parameters (
A
FHH
D
0.8<
x
exp
<
1.20) could, to first order, be applied to global
dust in aerosol-cloud interaction studies. Lathem et al. (
2011
) also demonstrated
that volcanic ash displayed CCN activity that was consistent with FHH-AT, but with
less hydrophilicity overall compared to dust. The latter was attributed to differences
2.25 and
B
FHH
D
Search WWH ::

Custom Search