Geoscience Reference
In-Depth Information
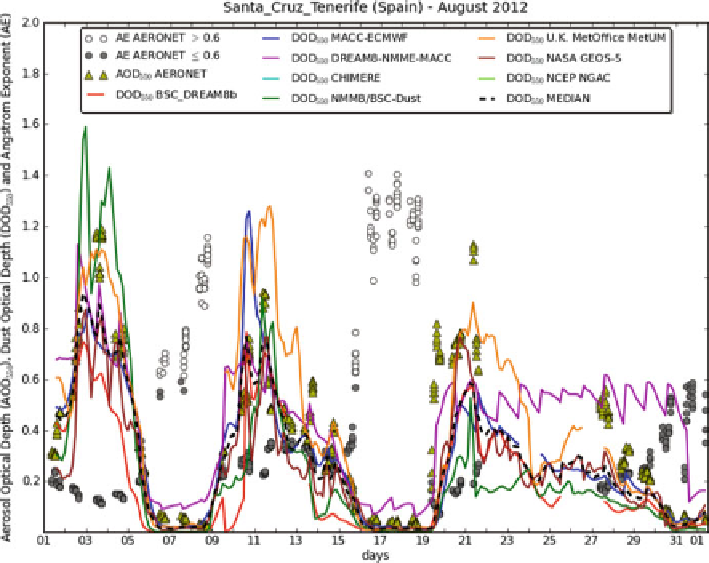
Fig. 10.4
Time series of aerosol optical depth at Santa Cruz de Tenerife (28.5 N, 16.2 W) for
August 2012. The plot shows the DOD forecast by the different models (
solid lines
), the median
value (
dashed black line
) and direct-sun AERONET observations (
yellow triangles
). An Ångström
exponent (
AE
) lower than <0.6 (
dark grey dots
) indicates that the observed AOD is associated with
the presence of desert dust
total atmospheric aerosol, without any distinction of the species. This evaluation is
complemented with regular reports describing the model performance to forecast
major and recent events (available online at
www.copernicus-atmosphere.eu
)
.
The calculation of scores is complicated by the geographic inhomogeneity of
the observation sites. AERONET sites are not spread evenly over the globe, but
are far more concentrated in developed parts of the world such as Europe and the
USA. The sites in use are also time-varying, with new sites appearing and old sites
disappearing. Taking simple means over the sites therefore leads to scores which
reflect the geographic spread of the sites at the time and which are strongly biased
towards certain regions.
In order to reduce geographic bias and increase long-term stability, model-
versus-AERONET scores are computed using weights for each observation that
reflect the local observation density at the observation time. This is done through the
calculation of “Voronoi polygons”. For a given set of points in space, the Voronoi
polygon around a given point is the region closer to that point than any other. At
each observation time, the polygons are calculated on the sphere for all available
Search WWH ::

Custom Search