Geoscience Reference
In-Depth Information
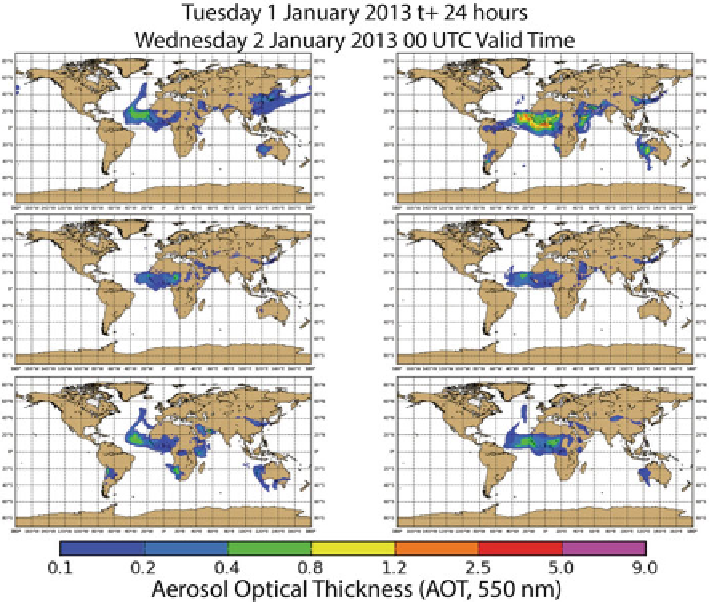
Fig. 10.2
Example of ICAP-MME 24 h dust forecasts of aerosol optical depth at 550 nm
wavelength valid for 2 January 2013. Models are ordered as follows: NAAPS (
top left
), GEOS-5
(
middle left
), MASINGAR (
bottom left
), NMMB/BSC-CTM (
top right
), MACC/ECMWF (
middle
right
) and NCEP NGAC (
bottom right
)
products describing spread (standard deviation and range of variation) are calculated
and are available daily at
http://sds-was.aemet.es/
.
An example of products is shown
in Fig.
10.3
. In order to generate them, the model outputs are bilinearly interpolated
toacommongridmeshof0.5
ı
0.5
ı
. The daily SDS-WAS NA-ME-E multi-model
median (together with the individual models) is continuously evaluated against data
10.4
Data Assimilation for Dust Prediction
10.4.1
Introduction
Data assimilation offers a mathematical framework to incorporate observational
information into models. When dust prediction was started at various operational
Search WWH ::

Custom Search