Geoscience Reference
In-Depth Information
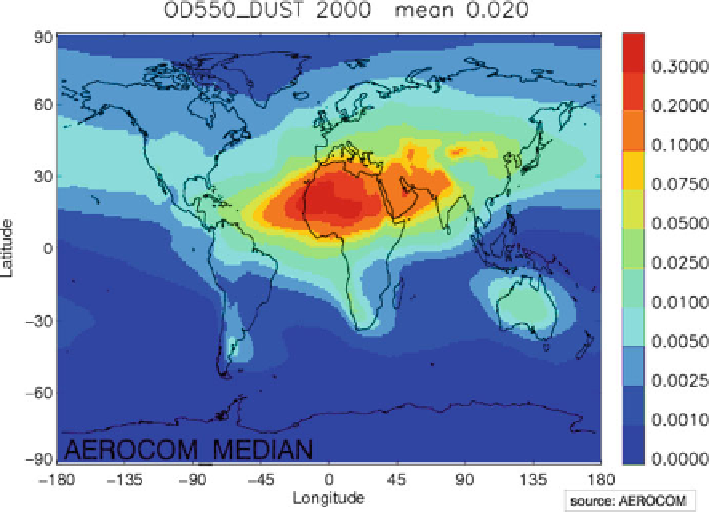
Fig. 9.6
Median dust optical thickness from the results of the AeroCom Experiment A models
like optical thicknesses and Ångstrom exponents agree within a factor of two with
observations. However, much less agreement is found for surface concentration and
deposition fields of mineral dust particles in comparison with measurements. Also,
the dust model results show large variations in dust concentrations for particular
regions. The averaged dust optical thickness values reported in the study by Huneeus
et al. also vary considerably resulting in global annual average values between
0.01 and 0.05. This indicates that uncertainties in the description of source areas
and processes controlling dust emission and deposition result in a wide range of
simulated dust fluxes and atmospheric dust optical properties. Uncertainties in the
descriptions of the initial size distribution of dust during emission are thus not only a
major uncertainty factor in determining the global dust budget but also an addition to
the uncertainties in the determination of dust optical properties and thus its radiative
effect.
It should be noted that the results discussed above represent global dust model
simulations that were completed before the year 2006. It is to be expected that
ongoing model developments lead to improvements of model performance and
parameterizations. However, dust observations near dust source regions are still
sparse, such that the diversities in the model-based description of the distribution
of dust properties near source regions remain a cause of considerable diversity in
the models.
Search WWH ::

Custom Search