Geoscience Reference
In-Depth Information
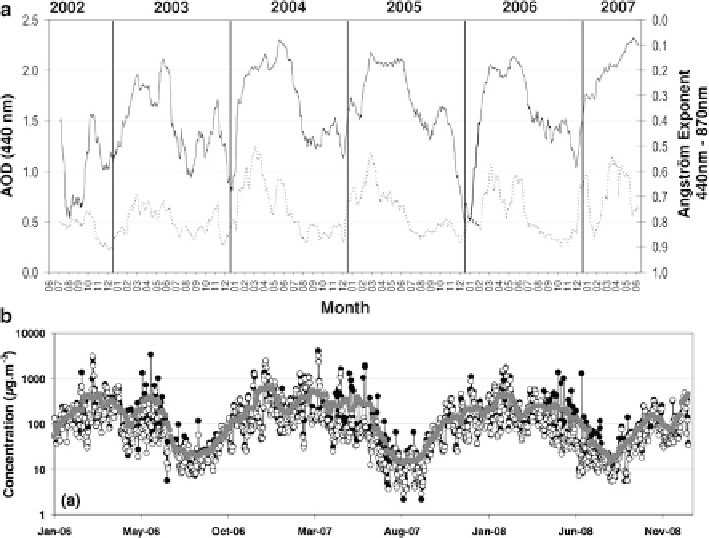
Fig. 7.1
Examples of multiyear measurements available for dust studies in West Africa at the
station of Banizoumbou (Niger). (
a
)
AOD and Angström exponent
: 30-day sliding averages of
daily AOD (440 nm,
dotted line
) and Angström exponent (440-870 nm,
solid line
) derived from
the AERONET sun photometer for 2002-2007. From Rajot et al. (
2008
). (
b
)
PM10
: daily mean
(
black circle
) and median (
open circle
) concentration and 30-day sliding average of the daily mean
(
grey line
) from 2006 to 2008 (From Marticorena et al.
2010
)
dust emissions and transport over surrounding oceanic regions. Although they are
restricted to a part of the globe, the frequency of measurements (15 min with MSG)
is of great benefit for research on dust (Schepanski et al.
2007
,
2009
; Thieuleux
et al.
2005
). Most of the sensors on polar-orbiting platforms are limited to one
observation of aerosol per day, a frequency which may, at least in certain cases,
prevent a representative measurement of daily dust content (Kocha et al.
2013
).
The spatial resolution also differs from one sensor to another, generally in the range
between
100 km (or 0.1-1
ı
). Besides differences in the measurement
techniques (especially spectral range) and algorithms used for aerosol retrievals, the
specific spatio-temporal coverage of each sensor may generate differences in the
dust load retrievals as well. So, as shown in Table
7.2
and in Sect.
7.3
of this chapter,
each sensor and product (from semi-quantitative indices to DOD) has been used
with specific purposes for dust studies. Since the launch of the CALIOP/CALIPSO
mission in 2006, vertically resolved observations of dust have become available, at
a global scale, a huge progress in dust observations (Sect.
7.3.4
). Remote sensing
data from global ground-based networks with sun photometers (i.e. AERONET)
10 km and
Search WWH ::

Custom Search