Geoscience Reference
In-Depth Information
a
b
c
d
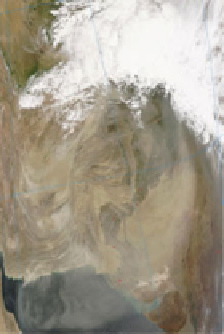
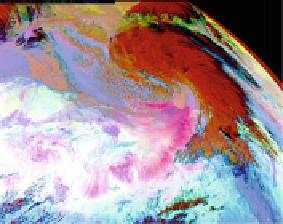
Fig. 6.3
Examples of synoptic dust storm Types I (
top
)andII(
bottom
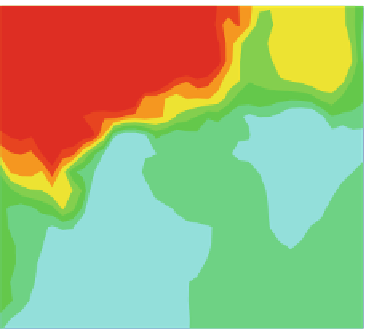
). (
a
) MODIS Terra visible
image at 0610 UTC 7 April 2005 showing an intense dust storm over India and Pakistan. (
b
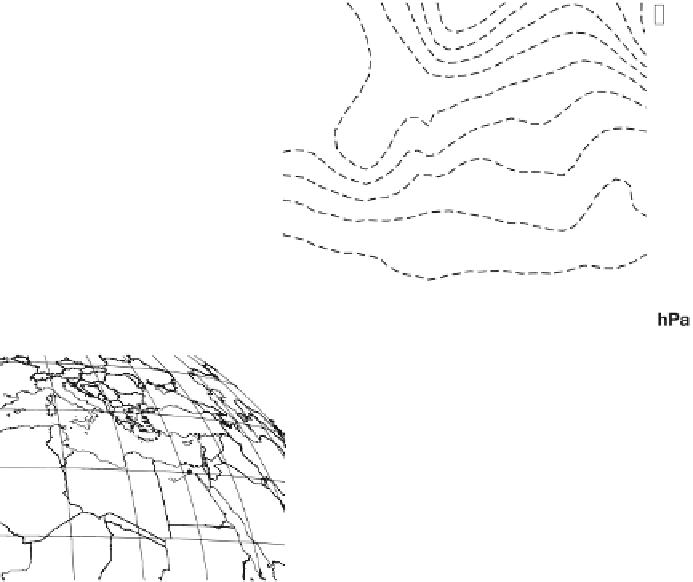
)
Associated patterns (at 00 UTC 7 April) of mean sea-level pressure (
shading
) and geopotential
height at 500 hPa (contoured every 60 gpm) from ECMWF data. (
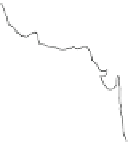
c
) Meteosat dust product showing
a Khamsin cyclone on 22 January 2004 including some synoptic station reports indicating dust
storms and strong winds (Fig. 9b in Knippertz and Todd
2012
). The
dark red colours
show the
main cloud mass of the cyclone and cold front, while
pink colours
indicate dust emission. (
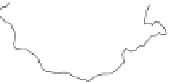
d
)Dust
storm over China as seen by the Chinese Geostationary Satellite FY-1C in the morning of 6 April
2000 (Fig. 12 in Shao et al.
2002
)
the Gobi Desert (Mongolia and China) show a sharp activity peak associated with
spring cyclones with a secondary maximum in autumn, while winter is dominated
by the cold Siberian anticyclone (Qian et al.
2002
; Shao and Wang
2003
; Yamamoto
et al.
2007
). Dust emissions mostly occur in the cold northwesterly and sometimes
westerly winds behind the front (Fig.
6.3
d; Sun et al.
2001
;Shaoetal.
2002
;Liu
et al.
2003
; Natsagdory et al.
2003
;Shaoetal.
2003
; Takemi and Seino
2005
;Tao
et al.
2006
).
North American dust events are also dominated by Type II cyclones during
winter and spring, often associated with marked upper-level troughs and jets (Orgill
and Sehmel
1976
; Novlan et al.
2007
). Most activity occurs over the southern
Great Plains including the Chihuahuan Desert in northern Mexico (Yin et al.
2005
;


Search WWH ::

Custom Search