Geoscience Reference
In-Depth Information
a
b
50
100
40
30
10
20
10
1
0
c
d
50
100
40
30
10
20
10
1
0
30-100
300-1000
30-100
300-1000
Total Fe (ng m
-3
)
Total Fe (ng m
-3
)
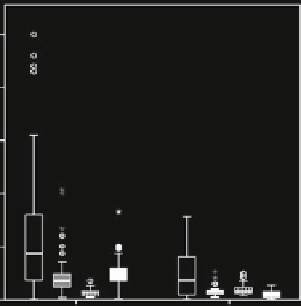
Fig. 4.4
Box and whisker plots
showing percentage soluble Fe for two subsets of the Sholkovitz
et al. (
2012
) data compilation: total Fe concentrations of 30-100 ng TFe m
3
and 300-1,000 ng
TFe m
3
. Characteristics of all the data in those concentration ranges are shown in (
a
) (linear y-
axis scale) and (
b
) (log y-axis scale). In panels (
c
)and(
d
), the data is further subdivided according
to the leaching solution used for soluble Fe determination (ultrapure water (
white
), ammonium
acetate (
grey
), formate (
vertical stripes
), seawater (
black
))
intercomparison exercise showed that acetate leaching solubilised more Fe than did
MQ (Morton et al.
2013
). Overall, the inter-method comparison shown in Table
4.1
provides further support to the observation of Aguilar-Islas et al. (
2010
) that inter-
sample variability is a more significant contributor to the wide range of observed
aerosol Fe solubility values than is inter-method variability.
Baker and Croot (
2010
) pointed out that it is very difficult to identify the mecha-
nisms responsible for the hyperbolic solubility relationship from field observations
of Fe solubility alone. Further insight can be gained by examining the behaviour
of other dust components and related chemical tracers in field data and through
controlled laboratory studies. Sholkovitz and co-workers (Sedwick et al.
2007
;


Search WWH ::

Custom Search