Geoscience Reference
In-Depth Information
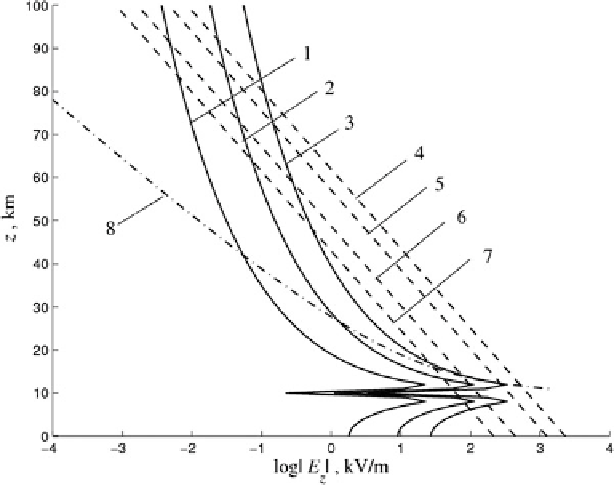
Fig. 3.20
Model calculations of thundercloud QE field just after a strong CCG which is able to
trigger sprite discharge. The absolute value of the vertical electric field for different thundercloud
charge q is plotted in this figure with lines 1-3 and 8 as a function of altitude:
1
—q
D
50 C;
2
—q
150 C, respectively. In making the plots 1-3 the air conductivity
was ignored. The breakdown threshold electric fields which correspond to different air breakdown
criteria are shown with dotted lines:
4
—conventional breakdown threshold,
5
—negative streamer
propagation,
6
—positive streamer propagation,
7
—relativistic runaway breakdown.
Dash-and-dot
line 8
illustrates the air conductivity effect on thunderstorm QE field (Surkov and Hayakawa
2012
)
D
100 C; 3 and
8
—q
D
with altitude more rapidly than does the thunderstorm electric field. So, there may
be a height above which the thundercloud electric field exceeds the breakdown
threshold (Wilson
1925
). As is seen from Fig.
3.20
, this situation may exist at the
mesospheric altitude range 50-80 km.
Actually, the generation of QE electric fields above a thundercloud may be
greatly reduced due to the exponential increase of the atmospheric conductivity
with altitude. The background atmospheric conductivity is a subject of a variety of
factors: cosmic-ray ionization rate, ion-neutral collision rate, electron attachment
and detachment and etc., which in turn vary with altitude due to changes of
the air density. However in the first approximation the air conductivity can be
approximated by Eq. (
3.1
); that is, as an exponential function of altitude
z
.The
thundercloud charge variations, which follow primary
C
CG stroke, are basically
due to the CC. However, if the time scale of the charge variations is much greater
than the relaxation time
D
"
0
=
a
due to air conductivity, then the problem is
reduced to a stationary one. In this extreme case a distribution of electric potential
Search WWH ::

Custom Search