Geoscience Reference
In-Depth Information
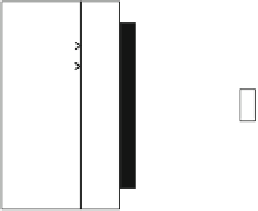
Fig. 9.1
A schematic
arrangement of laboratory
experiment devoted to the
shock polarization effect.
Adapted from Mineev and
Ivanov (
1976
)
SW
3
R
1
R
2
1
4
Fig. 9.2
A typical
oscillogram of the
polarization current caused by
the shock loading of NaCl
monocrystals. Adapted from
Mineev and Ivanov (
1976
)
U
, V
3,2
t
,
m
s
0
0,5
1,5
1,0
-3,2
electromotive force (EMF) or a jump of electric potential most likely occurs at the
shock front. The measured parameter is the voltage drop at the load resistance, R
1
.
The polarization current is directly proportional to the area, S, of the electrode.
Therefore, the area of the protective ring, S
1
, and the load resistance, R
1
, are chosen
so that S
1
R
1
D
SR. In this case, the voltage drop at the resistances R and R
1
are
equal. Under this arrangement the influence of lateral effects is avoided. The areas
used were S
1
D
S
D
1-3 cm
2
, the thickness of the sample was l
D
0.1-3 cm, and
R
1
D
R
D
92 Ohm are chosen to ensure the condition of a short-circuit. The latter
means that the circuit relaxation time t
r
l=V
s
where V
s
is the velocity of SW
propagation.
A typical oscillogram of the polarization current is depicted in Fig.
9.2
.The
current results from shock loading of monocrystal NaCl with a pressure magnitude
of 10 GPa (Mineev and Ivanov
1976
). The vertical axis corresponds to the voltage


Search WWH ::

Custom Search