Geoscience Reference
In-Depth Information
L
f
A
.
A
f
L
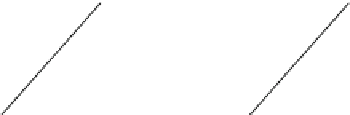
Fig. 8.3
A schematic plot of tortuous channel entering the sample on one side and coming out
the sample on the other side. This figure illustrates the capillary model of a porous medium by De
Groot and Mazur (
1962
) and Pfannkuch (
1972
)
such as
/
n
2
, has been demonstrated by Brace et al. (
1965
) and Ishido and
Mizutani (
1981
) for actual rocks. Taking the notice of n<1, we conclude that the
earlier assumption
/
n can lead to an overestimated value of the electrokinetic
current.
In the capillary model of porous media proposed by De Groot and Mazur (
1962
)
and Pfannkuch (
1972
) the porosity, tortuosity, and specific surface of pores are
taken into account. For illustrative purposes, Fig.
8.3
shows one tortuous channel
entering the sample on one side and coming out the sample on the other side. The
area of intersection between the channel and the sample surface is indicated by A
while the channel cross section is symbolized by A
f
. The channel length and the
sample thickness are indicated by L
f
and L, respectively. The basic characteristics
of the capillary model are introduced as follows: the porosity n
D
A
f
L
f
=.AL/,
tortuosity b
D
L
f
=L, and specific pore surface S
D
S
f
=
.
AL
/
where S
f
denotes
the area of internal capillary surface. According to this model the current density
is given by Eq. (
8.8
) where
r
D
nb
2
f
C
Sb
2
s
, and C
D
nb
2
""
0
&=.
It should be noted that the conductivity given by above equation is consistent with
observations if only b
n
1=2
that can hardly be conceived (Brace et al.
1965
).
It should be noted that Eq. (
8.8
) and other similar equations can be derived from
the general Onsager relations which connect the electrokinetic and electroosmosis
properties of porous media through the following set of coupled equations:
J
D
L
11
r
P
C
L
12
E
;
j
D
L
21
r
P
C
L
22
E
:
(8.10)


Search WWH ::

Custom Search