Geoscience Reference
In-Depth Information
0.07
0.065
7
6
5
0.06
0.055
2
3
0.05
4
0.045
1
0.04
0.035
0.03
0.5
1
1.5
2
2.5
3
3.5
4
f
, Hz
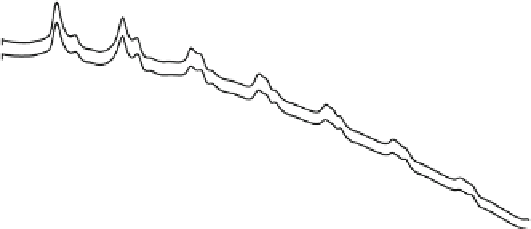
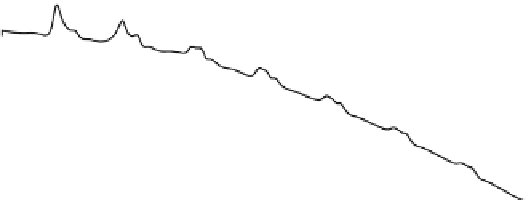
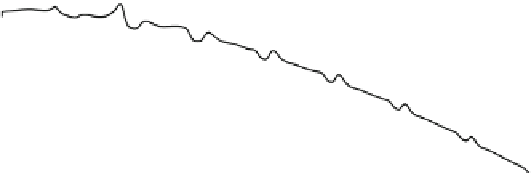
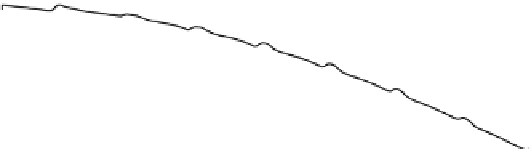
Fig. 5.17
Same as in Fig.
5.16
,butforr
D
0:4, 0:8, 1:2, 1:6, 2:4, 3:2,and4:0 thousands km.
Taken from Surkov et al. (
2006
)
To explain this dependence, we note that the correlation function
xx
can be
represented as a sum of correlation functions produced by individual thunderstorms
since they are statistically independent of each other. This means that the amplitude
of the correlation function can be roughly estimated as an integral over the area S
Z
1
N
xx
S
dS;
(5.64)
S
where
1
denotes the contribution of a single thunderstorm to the correlation
function and N=S is the thunderstorm number per unit square. It follows from
Eqs. (
5.59
)-(
5.61
) that
1
r
2
. In our model the mean value of N=S is
assumed to be constant so that we can move it outside the integral. Taking the
notice of dS
D
2rdr, and performing integration in Eq. (
5.64
), we obtain that
xx
ln r,asr
!1
. This logarithmic dependence of the correlation function
versus distance is compatible with that shown in Fig.
5.18
. It should be noted that
Fig.
5.18
only illustrates an increase of the absolute peak, whereas the relative peak
value (with deduction of background noise) does not increase with distance.
As we have noted above, it is generally believed that the main excitation of the
IAR at low latitude is due to the global thunderstorm activity (e.g., see Bösinger
et al.
2004
). This is due to the fact that the World thunderstorm centers are mainly
concentrated in the vicinity of tropics. In order to examine the possibility for the
same mechanism of the IAR excitation at middle and high latitudes, we consider one


Search WWH ::

Custom Search