Geoscience Reference
In-Depth Information
0.18
5
0.16
4
0.14
3
0.12
0.1
2
0.08
0.06
1
0.04
0.02
0
0.5
1
1.5
2
2.5
3
3.5
4
f
, Hz
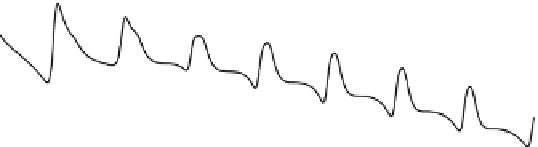
Fig. 5.14
A model calculation of the nighttime IAR spectra due to a solitary lightning discharge at
distance r
D
300 km. The component b
x
is shown with lines 1-5, which correspond to the angles
'
D
0, =8, =4, 3=8 and =2, respectively. Taken from Surkov et al. (
2006
)
b
x
D
b
'
sin '
b
r
cos '
; and
b
y
D
b
'
cos '
b
r
sin '
:
(5.62)
On the ground surface at
z
D
z
0
D
d the components b
r
and b
'
are random values,
which depend on polar radius r
and the time interval t
t
n
.
Experimental recordings of the horizontal field contain a certain mixture of
both resonant, b
r
, and non-resonant, b
'
, components. The observations depend
on the angle ' between the direction to lightning flash and to the x axis
(Fig.
5.13
). To illustrate this, we have calculated the spectra of a single CG
discharge at fixed distance r
D
300 km and different angles. The lines 1-
5 in Fig.
5.14
correspond to the angles '
D
0, =8, =4, 3=8, and =2,
respectively. Not surprisingly, the most distinct signature of the SRS is expected
for the angle '
D
0 when the signal is dependent on only the radial field in
contrast to the case of '
D
=2 when the signal contains only perpendicular, b
'
,
component.
As is seen from Eqs. (
5.54
) and (
5.55
), the magnetic field of the single lightning
discharge is proportional to the current moment magnitude, M
n
, and thus can be
written similarly to Eq. (
4.42
), i.e.,
b
r
;t
t
n
D
M
n
G
r
;t
t
n
, where
M
n
is a random value whereas
G
D
G
r
;G
'
;G
z
are deterministic functions,
describing the shape of single lightning discharge. The Fourier transform of these


Search WWH ::

Custom Search