Geoscience Reference
In-Depth Information
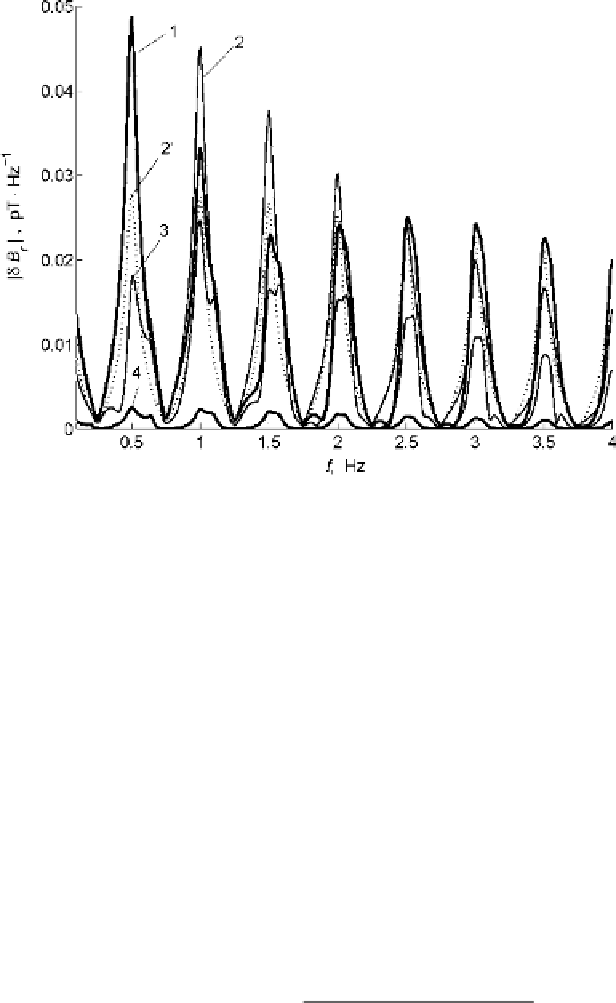
Fig. 5.12
A model calculation of the nighttime IAR spectra excited by a solitary CG lightning
discharge. The radial/resonant component ıB
r
on the ground is shown with lines 1-4,which
correspond to the distances r
100, 300, 1;000,and10;000 km, respectively. The approximate
analytical solution (Eqs. (
5.59
)and(
5.60
)) at distance r
D
300 km is shown with
dotted line
2
0
.
D
Taken from Surkov et al. (
2006
)
†
P
D
0:2
1
and †
H
D
0:3
1
(nighttime conditions). In this figure the lines
1-4 correspond to the distances r
D
100, 300, 1;000, and 10;000 km, respectively.
It is obvious from Fig.
5.12
that the spectra exhibit distinct resonance structure in
such a way that the resonance frequencies are close to the IAR eigenfrequencies. By
symmetry of the problem the radial component of the magnetic perturbation must
tend to zero when r
!
0. The calculations have shown that the spectrum magnitude
reaches a peak at the distance of about 300 km.
If the thunderstorm activity occurs at the distance r
10
3
km, that is far away
from the ground-recording station, then Eqs. (
5.54
)-(
5.57
) are simplified since the
integrands include the rapidly oscillating function J
1
.kr/ with the short period k
r
1
10
3
km
1
. The other slowly varying functions under the integral sign may
be moved through the integral at k
D
0 to yield
0
Ǜ
H
LMF .!/
1
.!/
2rd Œ1
C
1
.!/dq
1
.!/
;
ıB
r
.!;r;
d/
D
Mg
r
(5.59)
where
1
D
.
i
0
!/
1=2
, and
i
1
.!/L
1
C
1
.!/d
C
x
0
f
LJ
1
.!/
C
Ǜ
P
g
f
LJ
1
.!/
C
Ǜ
P
gC
x
0
Ǜ
2
H
:
q
1
D
(5.60)
Search WWH ::

Custom Search