Geoscience Reference
In-Depth Information
600
500
1
400
300
3
4
200
2
100
0
0
10
20
30
40
50
60
t
, min
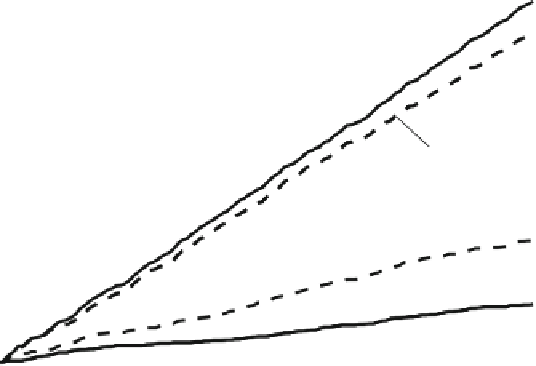
Fig. 5.10
Time variations of the magnetic impulse sum. The threshold level for the impulse
amplitude is 5 pT. The time interval is same as in Fig.
5.9
. The lines 1 and 2 correspond to
the frequency channels 6-20 and 0:25-4 Hz, accordingly. The impulses of solely H component
(6-20 Hz) is shown with
dash lines 3
while D component is shown with
dash line 4
. Taken from
Surkov et al. (
2006
)
Overall the SRS signature recorded at low-latitude station (Bösinger et al.
2002
,
2004
) located at a remote site in the island of Crete, Greece (35:15
ı
N, 25:20
ı
E,
L
D
1:3) is consistent with the morphology of the resonance spectra detected at mid
(L
D
2:1, Fedorov et al.
2006
) and high latitudes (L
D
5:2, Yahnin et al.
2003
).
The IAR excitation is usually observed at nighttime condition but practically not at
all during daytime. In contrast to mid and high latitudes, the resonance spectra of
the low-latitude IAR have been detected every night during a half year of operation
of the station at Crete (Bösinger et al.
2002
). Taking into account that the island
of Crete is near the African thunderstorm center, we can assume that the lightning
activity in this region is capable of sustaining daily generation of the SRS at low
latitudes. One more features of the low-latitude IAR is that the average frequency
difference between two adjacent spectral maxima is very small (0:2 Hz) and does not
exhibit local time variations from evening to nighttime. The seasonal dependence of
the resonance spectra was found to be very weak, but distinct.


Search WWH ::

Custom Search