Geoscience Reference
In-Depth Information
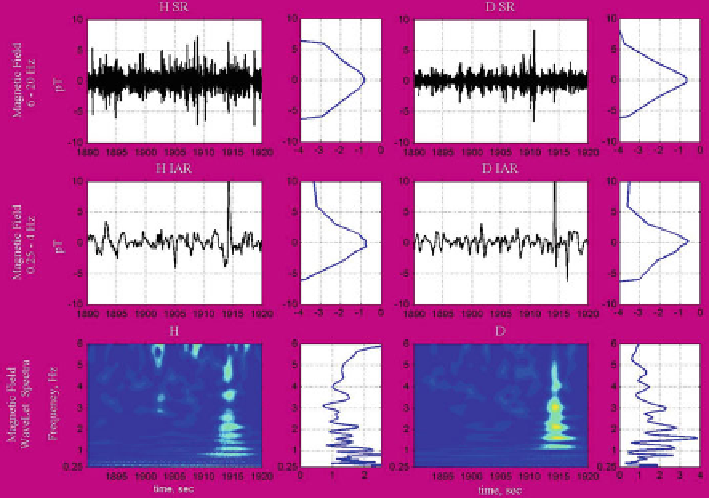
Fig. 5.6
Typical temporal dependences (
upper and middle lines
of panels), dynamic spectrograms,
and power spectra (
lower line
of panels) of magnetic background noise observed at Karimshino
station, Kamchatka peninsula on 13 September 2000. The time in seconds is counted from the
starting moment 2;100 LT. For details see the text. Taken from Surkov et al. (
2006
)
can be seen in Fig.
5.9
. In making this plot we have used the whole interval from 21 h
till 22 h and D component recordings related to only the low-frequency channel.
Some understanding of the experimental data alluded to above is necessary for
adequate interpretation of the phenomena. An electromagnetic wave originating
from a lightning discharge undergoes dispersion and dissipation in the Earth-
Ionosphere cavity in such a way that the low-frequency part of the wave spectrum
falls off more rapidly with distance than does the high-frequency part. This is due
to that the low frequencies determine the lightning near field which depends on
distance r as r
3
whereas the high frequencies make a main contribution to the far-
field spectrum which tends to decrease as r
1
. On the other hand, the quasistatic
field falls off faster with distance than the wave field. This means that in the ULF
frequency range the IAR spectrum from nearby lightning can be more intense than
that of more distant discharges.
As is seen from the upper row of the panels in Figs.
5.6
,
5.7
, and
5.8
, there
are many impulses that can be associated with thunderstorm activity and only
some of these impulses are accompanied by the sharp impulses in the frequency
range of 0:25-4 Hz. In the above notation, these latter impulses are assumed to
be a result from the nearly lightning discharges. In order to estimate the number
of lightning discharges per unit time we chose the signal discrimination level as
Search WWH ::

Custom Search