Geoscience Reference
In-Depth Information
z
z
B
0
V
AM
Magnetosphere
z = L
z
V
AI
IAR
F layer
s
P
s
H
V
A
x
E layer
z =
0
y
s
g
Atmosphere
z = -d
˃
Earth
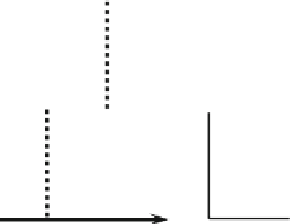
Fig. 5.4
A schematic drawing of a stratified medium model. The plots of the Alfvén velocity and
the ionosphere/ground conductivities are shown in the
right panel
Table 5.1
Values of ionospheric parameters used by Greifinger and Greifinger (
1968
) in fitting
Eq. (
5.1
) to the profiles of Sims and Bostick (
1963
)
Local time and sunspot conditions
2
L,km
V
A0
, km/s
Night, sunspot maximum
300
720
0:0027
Night, sunspot minimum
450
395
0:0063
Day, sunspot maximum
350
375
0
Day, sunspot minimum
435
195
0
ionospheric numerical profiles of Sims and Bostick (
1963
) which may be considered
as representative is quite well approximated by a simple analytical exospheric
profile suggested by Greifinger and Greifinger (
1968
)
V
A0
V
A
D
C
exp Œ
2.
z
z
0
/=L
:
z
>
z
0
/
(5.1)
2
Here we have taken the positive
z
direction to be vertically upward, where
z
0
denotes the coordinate of the Alfvén speed minimum. According to Greifinger and
Greifinger (
1968
) the values of the parameters entering Eq. (
5.1
) for a variety of
conditions are tabulated in Table
5.1
.
Since
2
1, this represents that the Alfvén speed increases exponentially from
its minimum value V
A0
at lower boundary
z
0
of the exosphere to the constant value
V
A0
1
in the outer magnetosphere when
z
tends to infinity. At nighttime condition
this constant value varies within an interval .5-14/
10
3
km/s.


Search WWH ::

Custom Search