Geoscience Reference
In-Depth Information
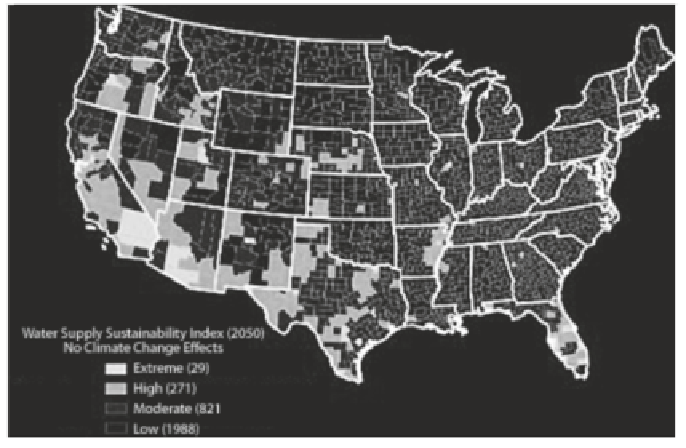
Figure 10
Water-supply stresses
across the United States
Water Supply Sustainability Index (2050)
No Climate Change Effects
Extreme (29)
High (271)
Moderate (821)
Low (1988)
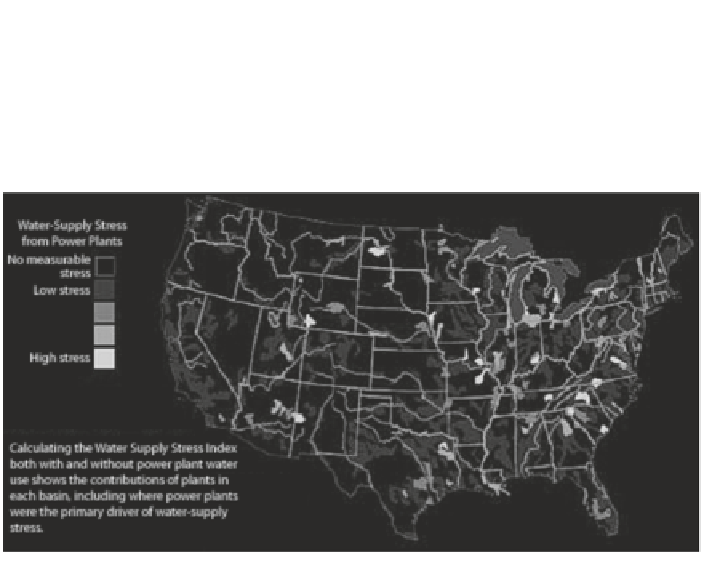
Water-Supply Stress
from Power Plants
No measurable
stress
Low stress
Figure 11
Where power plants
drive water supply stress
High Stress
Calculating the Water Supply Stress Index
both with and without power plant water
use shows the contributions of plants in
each basin, including where power plants
were the primary driver of water-supply
stress.
plant cooling technologies. Also, warmer water discharged from power plants can alter
species composition in aquatic ecosystems. Large coal and nuclear plants have, in sev-
eral cases in recent history, been limited in their operations by reduced river levels im-
pacting water intake structures, by higher temperatures, and by thermal limits on water
discharge (UCS, 2011).
Situations where the development of new power plants is being slowed down or
halted due to inadequate cooling water are becoming more frequent throughout the na-
tion. For example, Cooley et al discuss several instances of reduced production, plant
shutdowns, and revised conigurations of proposed new plants driven by reduced water
availability or anticipated constraints on new capacity. Current research at MIT for the
DOE Regional Integrated Assessment Modeling (RIAM) project indicates that the key
factor is EPA requirements that the water temperature in a power plant's “mixing zone”