Geoscience Reference
In-Depth Information
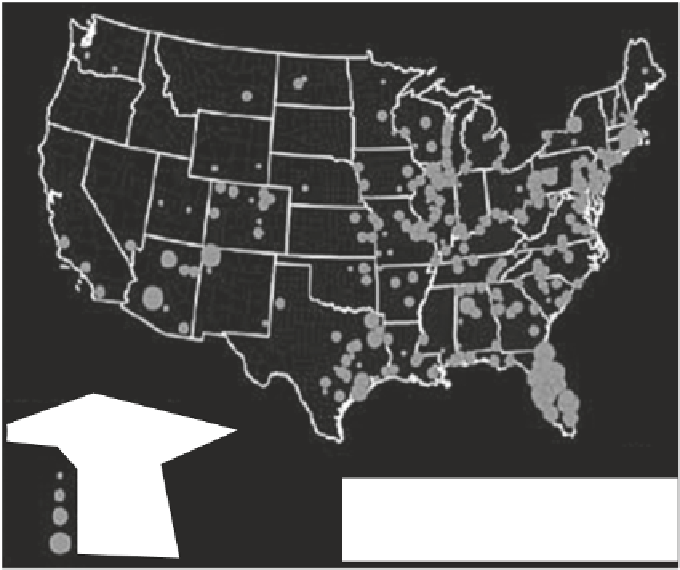
Figure 8
Water use for electricity
generation and other sectors:
Recent changes (1985-2005) and
future projections (2005-2030)
Projected New Power Generation
{2005-2030}gwl
501-1000
1001-5000
5001-10000
10001-17537
Projected new thermoelectric power generation
between 2005 and 2030 at the county level,
estimation based on EIA projections at the EMM
level.
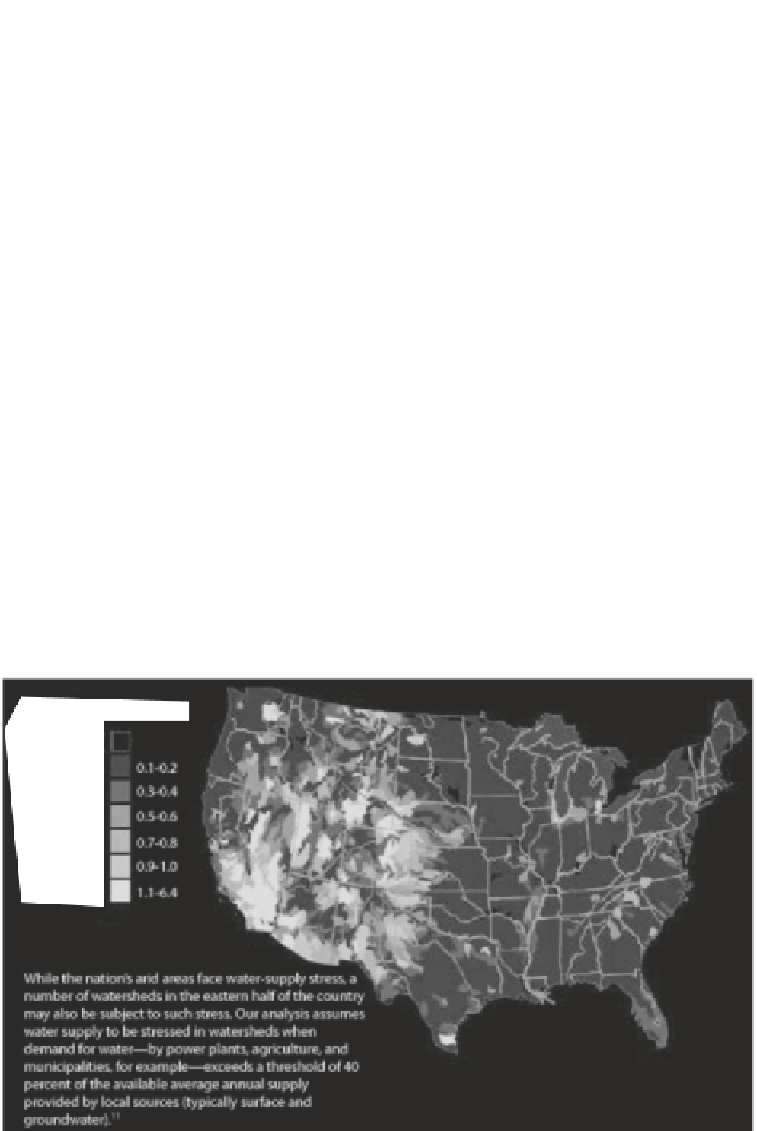
Water-Supply Stress Score
No measurable
stress
Low stress
0.1-0.2
0.3-0.4
0.5-0.6
0.7-0.8
0.9-1.0
1.1-6.4
High Stress
While the nation's arid areas face water-supply stress, a
number of watersheds in the eastern half of the country
may also be subject to such stress. Our analysis assumes
water supply to be stressed in watersheds when
demand for water—by powe plants, agriculture, and
municipalities, for example—exceeds a threshold of 40
percent of the available average annual supply
provided by local sources (typically surface and
groundwater).
11
Figure 9
Water supply stresses due to demands for electricity generation and other sectors: Recent
changes (1995-2005) and future projections (2050-2030)