Geoscience Reference
In-Depth Information
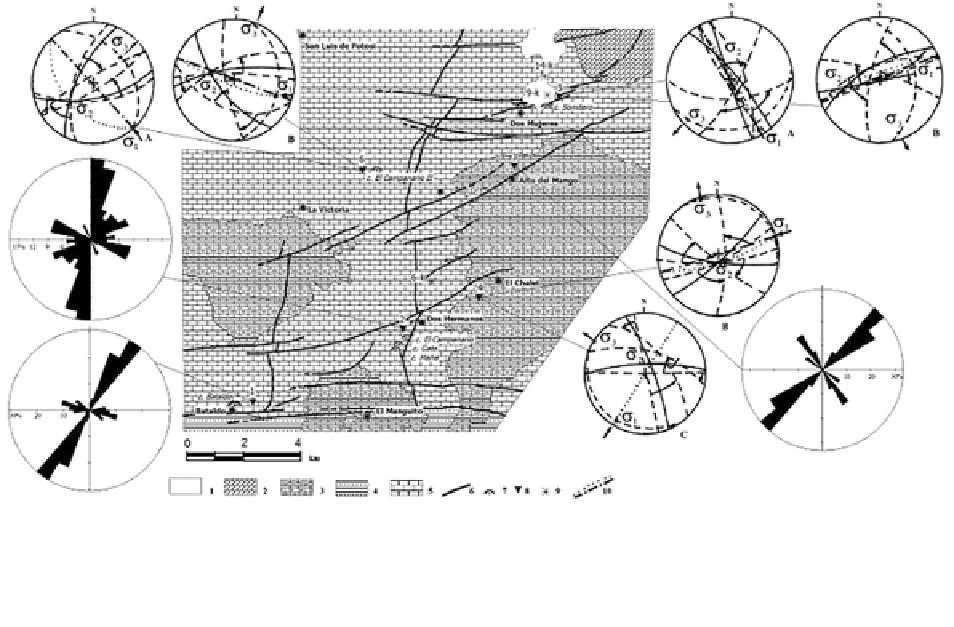
Fig. 2.48
Detailed geological map of the studied territory on
Plateau Guaso (Eastern Cuba) and reconstructions of the
tectonic stress fields based on measurements of joints (on the
base
4—Formation SLU; 5—Formation CHR; 6—fault; 7—cave
entrance; 8—site of structural measurements; 9—site of studies
of the electrical anisotropy; 10—most probable position of the
open fractures on the stereograms
of
the
map
elaborated
by
K.
Bonev)
1—Quaternary
sediments—Q;
2—Formation
YAT;
3—Formation
MAQ;
young rocks, are due to the tropical conditions of
karst formation and evolution.
the scheme of the fault systems drown on the base of
remote photos and field verifications (Fig.
2.48
).
Sites 5 and 6 characterize fracturing of the lime-
stones of CHR Formation. Two tectonic stress fields
are detected in this formation. The first one (A) and
maybe the oldest for this formation has provoked the
opening of fractures with NW-SE direction. The
second one (B), being of great importance for
the recent tectonic situation in the region, determines
the existence of sub-equatorial fractures and faults,
controlling the step-like subsidence of CHR Forma-
tion to the south. This tectonic stress field acted after
the consolidation of the sedimentation of MAQ For-
mation, because it was also reconstructed using the
joint set in the marls of this formation (Site 4). The
variations in the directions from N 80 to 110 cor-
relate well with the regional faults near the sites of
measurement. The sub-equatorial faults are in some
places barrier for the karst processes and re-distributor
of the water. The commented tectonic stress field
coincides with deformation phase D1 of N-S exten-
sion, exemplified mainly by karst-filled extensional
veins and normal faults (Rojas-Agramonte et al.
2003
).
These authors correlated this deformation with the
2.3.3.3 Tectonic Stress Fields and Their
Control on the Karst System
Two methods were applied for the analysis of the
tectonic stress fields—Nikolaev's Method (Nikolaev
1977
), based on the dispersion of the shear joints
density and studies of the electrical anisotropy.
Additionally, at three sites only, the directions of few
fractures have been measured (number from 10 to 20)
and rose-diagrams were plotted in Fig.
2.48
—sites 1,
2 and 3. These rose-diagrams reflect normally the
strike of the adjacent lineaments and they are not
sufficiently
informative
for
reliable
geological
conclusions.
Quite different, as quality, is the information from
the sites of mass measurements of shear joints. It
permitted the reconstruction of the tectonic stress
fields and the analysis concerning their impact on the
karst formation and evolution (Fig.
2.48
—sites 4, 5
and 6). The tectonic interpretation of the diagrams of
the electrical anisotropy has been made also in the
context of the tectonic stress field reconstructions and