Geoscience Reference
In-Depth Information
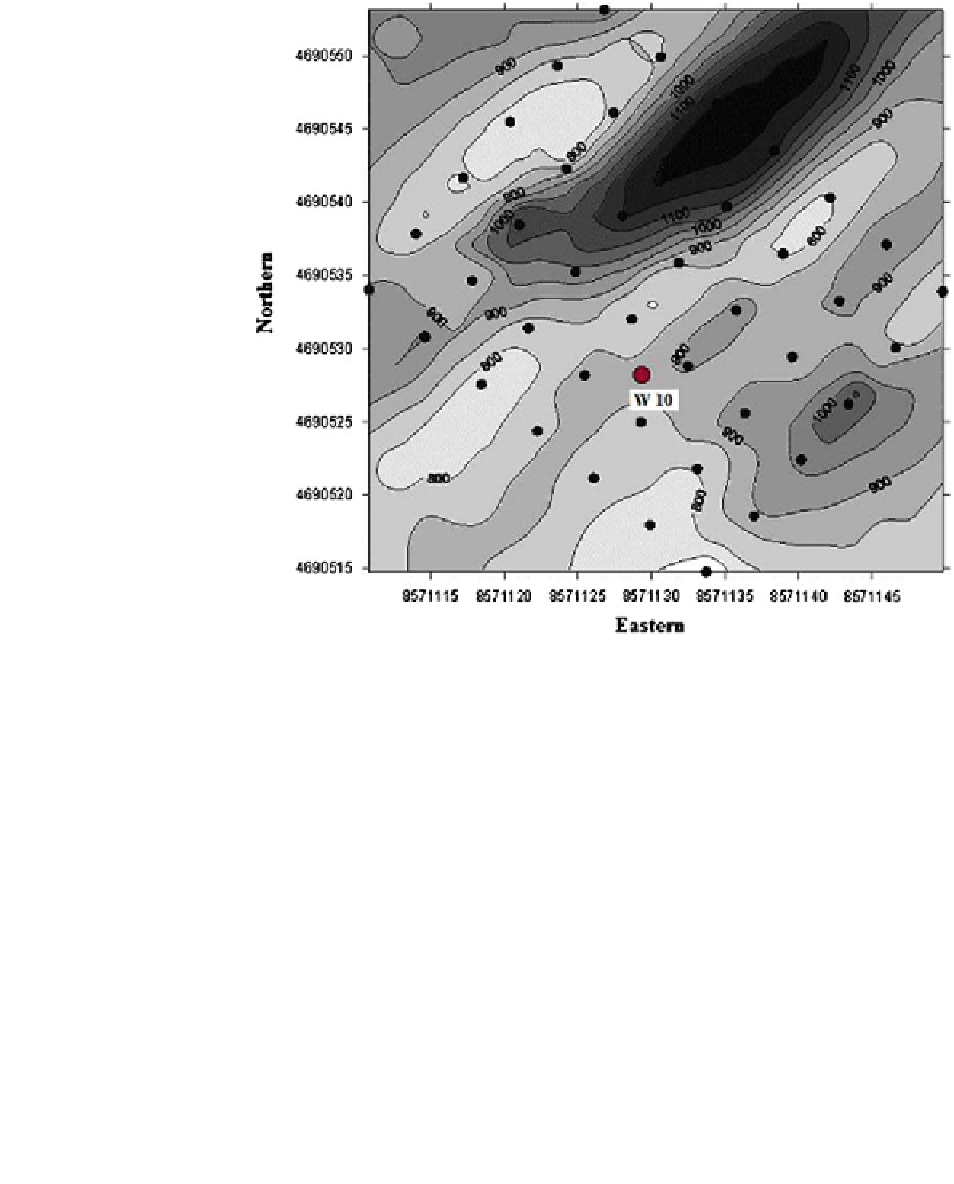
Fig. 2.18
Detailed map of
the apparent electric
resistivity anomaly zone
around Well 10. The dots are
the points of measuring of the
apparent electrical resistivity
5. The energy released during the earthquake,
immediately before the earthquake, is the energy
of the elastic deformation of the rocks.
This theory also initiates the development of the
Dislocation theory of earthquakes. Without any
details upon the theory (very well shown in the works
of Stacey
1972
; Cox and Hart
1989
, and others), it is
important to note that this theory created the basis for
explanation of the character of the emitted seismic
waves, depending on the type of movement along the
dislocation. The main idea is to present the final
dislocation in the earthquake focus as an equivalent of
a pair of stresses with or without moment. There is no
united opinion about which of both cases describes
more precisely the processes in the focal zone. In any
case, the pair of stresses with moment describes better
the arising of medium disruption, moving along it,
and creation of waves of ''contraction'' and ''dilat-
ancy'' (Fig.
2.19
), which are registered with different
polarity of their first breaks on the seismograms.
Usually, the study of the seismic source is through
analysis of the seismic waves' records on seismic
stations, outlying from the focal zone at a distance
Fig. 2.19
Formation of waves of ''contraction'' and ''dilat-
ancy'' in the earthquake focus (following Drumia and Shebalin
1985
)
bigger than the size of the focus. It means, loss of a
considerable quantity of information due to fading of
the high frequencies with the distance. Nevertheless,