Geoscience Reference
In-Depth Information
(c)
Tohoku
Region
Aneyoshi
Bay
Ryoishi
Sendai
Fukushima Nuclear
Power Plant
Tokyo
(a)
0
10
20
30
40
Water Height (m)
(b)
1968
1994
1933
1896
1915
1897
Sendai
(d)
1897
1936
DART Buoy #21418
1.5
1.0
0.5
0.0
-0.5
869
1938
2011 Strong slip
Tokyo
2011 Modest slip
03:00 GMT
6:00
9:00
12:00
15:00
2011 Epicenter
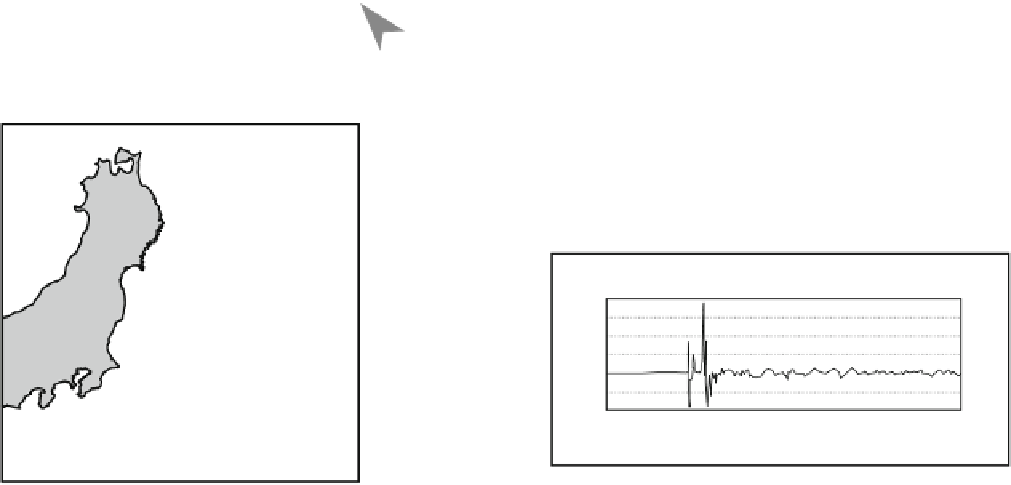
Fig. 6.16
Map of the Japanese T ¯hoku Tsunami, March 11, 2011.
a Location map. b Epicenter and slip zones of the March 11, 2011
earthquake together with those for historic events. Based on Kanamori
(
2011
). c Run-up heights along the Japanese coast. Based on Earthquake
Engineering Research Institute (
2011
), National Geophysical Data
Center (
2013
). d Height of the tsunami as measured at DART Buoy
#21418. Based on National Oceanic and Atmospheric Administration
(
2013
)
Fig. 6.17
The first wave of the
T¯ hoku Tsunami March 11, 2011
swamping the coastal plain in
front of Sendai Airport,
Iwanuma, Miyagi Prefecture,
northeastern Japan.
REUTERS/Picture Media\11-3-
11\KYODO\SIN35\