Geoscience Reference
In-Depth Information
of as spheriodal models or Rayleigh waves (combinations of shear and compressional wave
propagation) with a group velocity in the range of 4.5 km/s (mantle shear velocities) to 9 km/s
(mantle compressional velocities) over a frequency range of 1-10 mHz. The wave comprises the
fundamental as well as the irst three overtones.
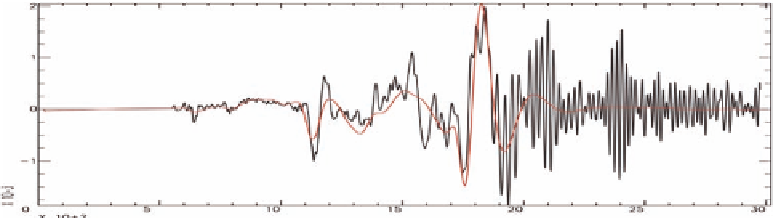
Figure G.1, reproduced from Kanamori and Rivera,
7
shows a synthetic seismogram (red)
from the supervision of spheroidal modes mentioned above. Kanamori and Rivera
7
note that
at a distance of 50°, the W phase energy is contained within 23 min of the origin time and in
time to have a positive impact on tsunami warnings. The W phase arrives following the P-wave
and before conventional surface waves, and can be regarded as a very low frequency, fast
propagating group of waves. Following a number of investigations, the systematic use of the
W phase has now been implemented at the National Earthquake Information Center (NEIC)
of the U.S. Geological Survey (USGS) in Golden, Colorado, and it may constitute a signiicant
improvement as a complement to the existing algorithms in use at the TWCs.
In practice, time domain deconvolutions are used to extract the W phase from the data
from stations in the Global Seismic Network (GSN). The deconvolution seeks to latten the
velocity spectrum over the broad frequency range above (1-10m Hz) and integrate the result
to get displacement. Unfortunately, this is an inherently noisy process, which has to deal with
the 360 s (2.8m Hz) corner in the velocity response of the GSN-standard STS-1 seismometer
(Figure G.2).
The mass in a seismometer, whether vertical or horizontal, is caused to move by an applied
force, which may be associated with the motion of the seismometer frame, or changes in the
force of gravity. The linear relationship between force and acceleration causes the mass to
move with the applied acceleration. The force and acceleration, of course, disappear following
an earthquake so the static acceleration is zero. Most seismometer responses, including the
GSN STS-1, are shaped by a judicious choice of poles and zeroes in the feedback electronics to
be lat to velocity over some frequency range.
O.T.
2001 Peru (
M
w
=8.4) HRV (
∆
=58.5
°
)
surface wave
W phase
10 min
S
P
0
500
1,000
1,500
2,000
2,500
3,000
FIGURE G.1
Phase from the 2001 Peruvian earthquake (Mw = 8.4) recorded at Harvard University Seismic
Station (HRV), and the synthetic W phase computed by mode summation using the Global Centroid-
Moment Tensor (GCMT) solution. SOURCE: Kanamori and Rivera, 2008; with permission from John Wiley
and Sons.