Geoscience Reference
In-Depth Information
water height, m
0.5
0.4
0.3
0.2
0.1
0.0
-0.1
-0.2
-0.3
-0.4
200
220
240
260
200
220
240
260
-0.5
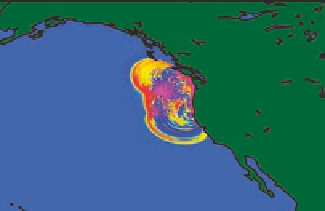
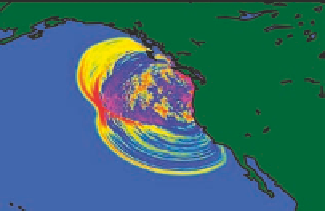
FIGURE 4.10
Two snapshots from a simulation of the great 1700 tsunami that was generated by a
magnitude 9.0 earthquake on the Cascadia subduction zone. The left panel shows the sea level displace-
ments after one hour and the right panel after two hours. Warmer colors show wave crests; cooler colors
are the troughs. After one hour, the leading crest has already inundated the local coastlines of Oregon,
Washington, and Vancouver Island and has passed San Francisco Bay. On the west side of the disturbance,
the initial crest is over 800 km from the coast after one hour. After two hours, the initial wave crest is well
within the Southern California Bight on its way to Los Angeles. SOURCE: Satake et al., 2003; reproduced
by permission of the American Geophysical Union; http://serc.carleton.edu/NAGTWorkshops/ocean/
visualizations/tsunami.html.
perished in the huge tsunami that followed, which had a maximum run-up in excess of 30 m.
Tsunami earthquakes are not rare. In addition to the Meiji Sanriku tsunami, Okal and Newman
(2001) list the following tsunami earthquakes: the 1946 Aleutian Island tsunami; the 1963 and
1975 Kuril Island tsunamis; the 1992 Nicaragua tsunami; the 1994 and 2006 Java tsunamis; and,
the 1996 Chimbote, Peru, tsunami. To detect a tsunami earthquake, direct measurements of the
water-surface variations and/or water currents are required in near-real time. Such measure-
ments are also critical for detecting tsunamis generated by submarine landslides. One way to
accomplish such measurements is to utilize the data from existing and planned cabled ocean
observatories.
Several cabled sealoor observatories are currently in operation or will be constructed
in the near future off North America. These observatories comprise various sensors or sen-
sor systems that are connected to each other and to the shore by a sealoor communications
cable. This cable also provides power to the sensors and a pathway for high-speed data return
from the sensors. The sensors gather a variety of oceanic and geophysical data that are trans-
mitted in near-real time via the iber optic cables from the sealoor to onshore data servers.
Among the sensors are those useful for tsunami detection; for example, bottom pressure sen-
sors, seismometers, current meters, hydrophones, gravimeters, and accelerometers. The cable
can deliver relatively high amounts of electric power to support many sensors acquiring data
at high sampling rates. Observatories are currently in operation off British Columbia (North-
East Paciic Time-Series Underwater Networked Experiments, NEPTUNE-Canada: http://www.