Geoscience Reference
In-Depth Information
that even the southern hemisphere shows moderate but significant
patterns. It is however necessary to calculate averages over a
sufficiently long period of time for a mean figure to emerge since the
large natural variability from one year to another can mask signs of
warming.
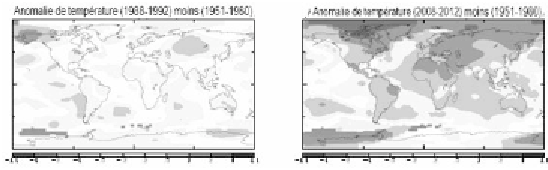
b) Temperature anomaly (2008-2012)
minus (1951-1980)
a) Temperature anomaly (1988-1992)
minus (1951-1980)
Figure 2.2.
Distribution of anomalies in temperature on the Earth's surface for 1988-
1992 and 2008-2012 compared to the reference period 1951-1980 (according to
http://data.giss.nasa.gov/gistemp
/)
(see color section)
This warming of the land's surface manifests itself in numerous
effects such as the decrease in snow coverage in winter as well as the
almost universal melting of glaciers, at low latitudes as well as at
temperate latitudes. The rapid melting of the sea ice is equally
manifest and its extent has constantly diminished to reach a minimum
coverage in September 2007, when it was reduced to 39% less than
the average over 1979-2000, a record reached again in 2012.
The world's oceans are warming and the warm patterns, initially
observed in the surface layers, are slowly penetrating the interior
where they are observed up to a depth of 3,000 m in some regions.
However, the distribution of the warm patterns is far from being
homogeneous since it depends on the overall circulation of the oceans,
which we will discuss later.
2.2.2.
Interpretation of the observed changes
The Earth's climate is far from being stable and its history shows a
complex evolution. Multiple factors shape it and contribute to its
evolution on different time scales. The shape of continents, for