Geoscience Reference
In-Depth Information
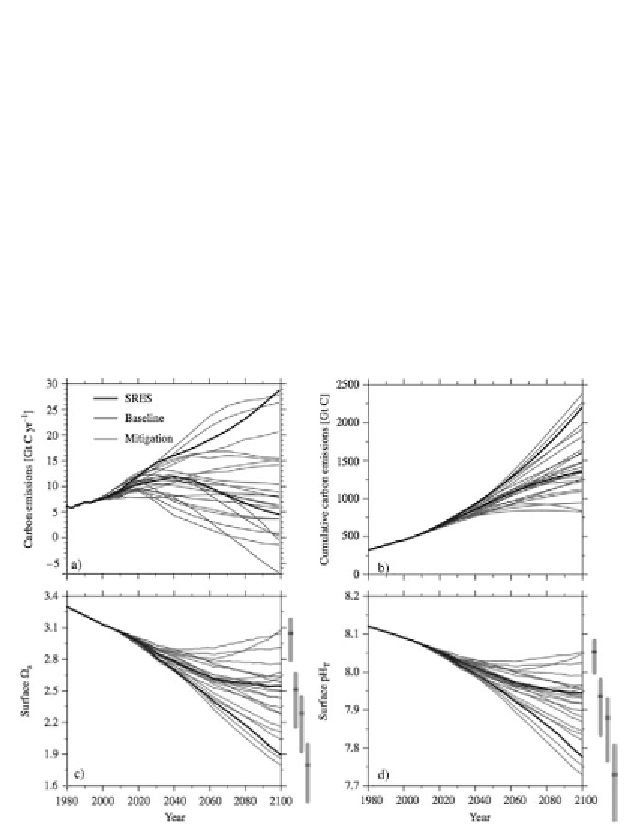
peak in emissions between 2020 and 2040 with a maximum emission
that is 50% higher than in 2000 [JOO 11].
The changes in argonite saturation (Ω
a
) and pH in the surface waters
follow the changes in CO
2
emissions. The mean value of Ω
a
, which was
approximately 3.7 in the pre-industrial period, decreases to reach 1.8-
2.3 in 2100 with the reference scenarios and 2.4-3.1 with the scenarios
that include mitigation. pH
T
decreases from a pre-industrial value of
8.18 to 7.73-7.88 and 7.90-8.05, respectively, with the baseline
scenarios and with those that include mitigation. The lowest pH
T
value
found with the most extreme scenario is 7.6. It is important to note that
the uncertainty over the projections of Ω
a
and the pH is almost
exclusively due to the uncertainty of CO
2
emissions.
Figure 5.5.
Annual (a) and cumulative (b) CO
2
emissions used in the Bern2.5CC model
and the resulting saturation in aragonite (c) and pH
T
(d). The base scenarios are
indicated in red, whereas the mitigation scenarios are shown in blue. The scenarios
with high (SRES A2) and weak (SRES B1) CO
2
emissions are in black. The gray line
shows the uncertainties in 2100 for the RCP scenarios. According to [JOO 11]
(see color section)