Geoscience Reference
In-Depth Information
The winds and air-sea fluxes inside cyclones remain largely
unexplained. Often,
in situ
instruments do not function properly in
winds greater than 40 ms
-1
, and satellite scatterometer data are not fully
exploitable in these structures. It has been possible to document the
wind structures inside cyclones using airborne flights, some buoys, and
also by using new instrumentations, such as the “Aeroclipper” drifting
balloons from
Centre National d'Études Spatiales
(CNES) in 2007.
More recently, radiometric data in L band (ESA's satellite mission Soil
Moisture and Ocean Salinity (SMOS)) have also supplied interesting
information on the wind distribution within cyclones, illustrating strong
variations over less than 50 km in some structures.
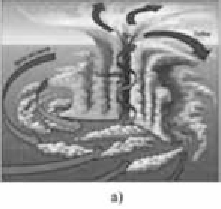
Figure 3.4.
a) The structure of a cyclone: the spiraled arm of the cumulo-nimbus
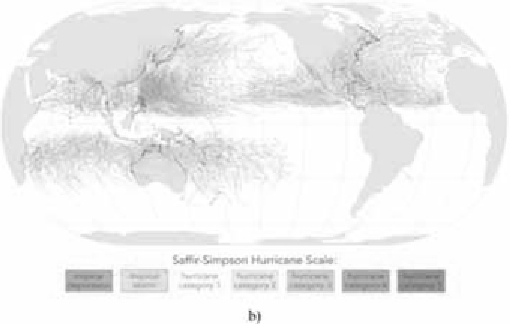
surrounding the calm eye (taken from www.pitt.edu/~super7/20011-21001/20671.pdf) b)
Trajectories of cyclones over the period 1945-2006. The color scale indicates the
systems' intensity (http://commons.wikimedia.org/wiki/File:Tropical_cyclones_1945_
2006_wikicolor.png, data from the Joint Typhoon Warning Center and the US National
Oceanographic and Atmospheric Administration) (see color section)