Geoscience Reference
In-Depth Information
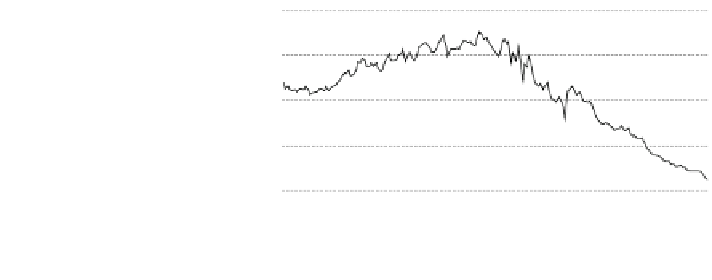
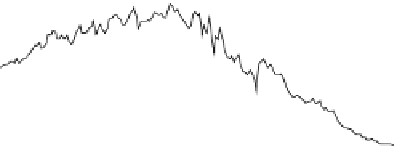
Fig. 1.8 Energy intensity in
western Europe between
1820
-
2005 (per capita GJ
(000)/per capita GDP in 1990
dollars PPP). Source Kander
et al. (
2013
)
25
20
15
10
5
0
The advantages of machinery and technological change in terms of energy yield
are easily visible if energy consumption (expressed in some energy measure) is
divided by product (in money). The result of the ratio is the so called energy
intensity (E/Y) (Fig.
1.8
). The curve of energy intensity shows that, during the 19th
century, some increase occurred in the energy/GDP ratio, due to the exploitation of
coal by inef
cient technologies especially in England, the main producer and
consumer of coal. From 1900 on a remarkable decline took place. In the year 2000,
the production of the same output required half the energy used some 200 years
earlier.
A decline in energy intensity occurred in the second half of the 20th century in
almost all world economies; although the differences were still
remarkable
(Table
1.7
).
From 1820 until 2000, GDP per capita rose 16 times in western Europe, while
energy input per head rose about 8-fold and ef
ciency in the use of energy doubled.
A decomposition of per capita GDP proves to be useful in order to specify the
relative importance of the input of energy and the ef
ciency of its exploitation. Per
capita GDP (Y/P) can be represented as the result of energy consumption per capita
(E/P) divided by the productivity of energy (Y/E):
Table 1.7 Energy intensity in different economies 1950
1990 (in Toe per $1,000 of GDP
-
constant prices)
OCDE
CPE
DC
OPEC
1950
0.55
1.70
0.23
0.10
1960
0.51
1.97
0.31
0.25
1970
0.52
1.66
0.38
0.22
1980
0.44
1.57
0.44
0.29
1990
0.36
1.39
0.46
0.44
Source elaboration of data from Pireddu (
1990
)
Note OCDE the organisation for cooperation and economic development; CPE centrally planned
economies; DC developing countries; OPEC the organisation of the oil producer countries