Geoscience Reference
In-Depth Information
150
120
90
60
30
0
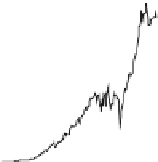
Fig. 1.3 Per capita energy consumption of traditional and modern carriers in western Europe
1500
2005 (GJ). Source Kander et al. (
2013
). Note 1 GJ = 1 million KJ = 0.0239 Toe
-
times, total energy consumption registered a 20-fold increase (Table
1.3
). The global
crisis of the
rst decade of the 21st century resulted in a fall of energy consumption.
Until about 1840, energy consumption per head did not increase in Europe, since
the input of fossil fuels rose at the same rate as the population. From 1840 onwards
until the First World War, growth was instead remarkable. After a period of stability
between the two World Wars, a signi
cant increase took place from the 1950s until
the 1970s, followed by a slower rise. In the long run the growth witnesses an almost
constant rate with brief deviations due to wars or epochs of fast economic rise
(Fig.
1.4
).
On the World scale, the rise of per capita consumption has been 5.7 times
between 1850 and 2000. Since population growth was 5.8-fold, the aggregate rise
Table 1.3 Energy consumption in western Europe from 1800 until 2000 in kcal per capita per
day, in Toe per capita per year, population and total energy consumption in Mtoe
kcal per
capita
per day
Toe per
capita per
year
Traditional
sources (%)
Rate of
growth
(%)
Population
(000)
Total
Mtoe
1800
15,300
0.56
77
96,950
54
1830
16,700
0.61
62
0.29
118,800
72
1900
42,000
1.53
20
1.32
194,800
299
1950
46,500
1.70
13
0.20
254,500
432
1970
82,200
3.00
7
2.85
293,700
880
1990
86,800
3.17
7
0.27
316,900
1,004
2000
90,700
3.31
8
0.44
327,400
1,084
2010
88,000
3.21
8
−
0.30
336,000
1,079
Source Kander et al. (
2013
)
Note data refer to western Europe: Sweden, The Netherlands, Germany, France, Spain, Portugal,
Italy. 1 Megatoe = 1 million Toe