Geoscience Reference
In-Depth Information
5.2 Properties of the Mollic Epipedon
Although the requirements of the mollic epipedon are defined in ST, the present
analysis attempted to determine the variation in properties of the mollic epipedon or
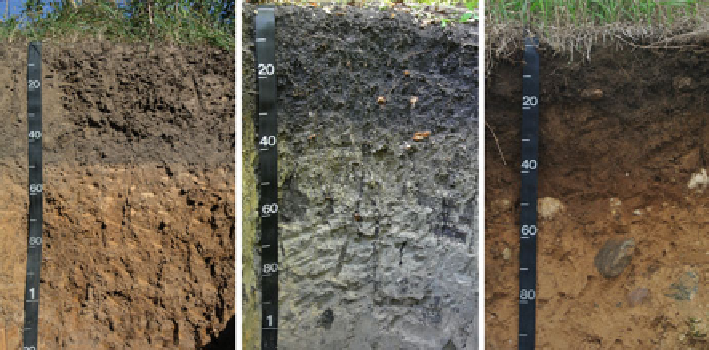
subgroup, especially within the six orders in which it occurs. Figure
5.1
contains
photographs of three soils with a mollic epipedon from Wisconsin, including a
Pachic Argiudolls, a Typic Endoaquolls, and a Typic Argiudolls. The thickness of
the mollic epipedon was greatest for soil series within the Vertisol order, averaging
72 cm; followed by the Mollisols and Andisols (48 and 43 cm, respectively); and
the Entisols, Alfisols, and Inceptisols (20 cm each) (Table
5.1
). Moist Munsell
colors among the six orders containing soil series with mollic epipedons or sub-
groups were comparable; average color values and chromas were three and two,
respectively.
The SOC concentrations of the mollic epipedon or mollic subgroup were
greatest for the Inceptisols (3.5 %) and Andisols (3.0 %), intermediate for the
Mollisols (2.2 %), and least for the Alfisols, Vertisols (1.6 % each), and Entisols
(1.4 %; Table
5.1
). A minimum value of only 0.6 % SOC is required for a mollic
epipedon. Base saturation values were all high but lowest for Andisols, Alfisols, and
Entisols (80-84 %), followed by Mollisols and Entisols (90 %), and Vertisols
(96 %). A base saturation of 50 % or more is required for a mollic epipedon.
Sixty-six percent of representative Mollisol soil series had an argillic subsurface
horizon underlying the mollic epipedon, and 21 % had a cambic horizon (Table
5.1
).
All of the Alfisols with a mollic epipedon had an argillic horizon; and cambic
horizons were dominant beneath the mollic epipedon in Inceptisols (88 % of total
soil series), Andisols (69 %), and Vertisols (65 %).
Fig. 5.1 Pachic Argiudolls (
left
), Typic Endoaquolls (
middle
), and Typic Argiudolls (
right
) - all
from Wisconsin, USA (Photos by A.E. Hartemink)
Search WWH ::

Custom Search