Database Reference
In-Depth Information
Step 1
In Figure
16-5
, CPU utilization is high across most of the servers in the 4-node cluster. Server 1 is the highest. Drilling
down into server 1 by selecting the legend that appears on the right side of the chart provides a detailed view
(illustrated in Figure
16-6
) of the statistics that have been collected on that server.
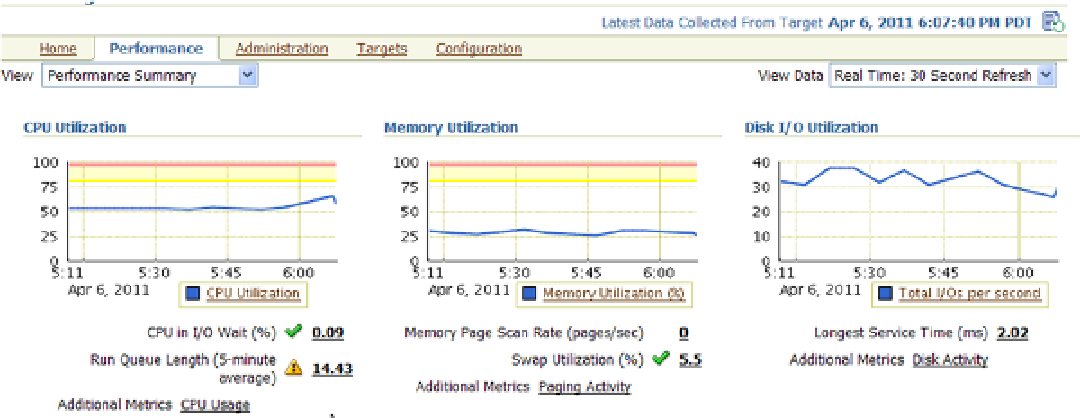
Figure 16-6.
Oracle11g performance statistics
Step 2
Once the resource (CPU, memory, disk I/O) that needs further investigation is identified, selecting the legend below
the chart will provide a historical chart for the specific resource going back to when the server was last restarted.
This chart gives an indication of whether the resource utilization has been consistent over a period of time or is being
noticed for the first time, in which case it could be considered as a spike.
Step 3
The information collected helps drill down into the instance-level statistics. The node-level monitoring of the
database shows that there was high virtual memory paging earlier.
As advised by the ADDM analysis report on investigating the allocations, Figure
16-4
shows that memory
utilization is not even at 50%. Adding memory is not always possible and may not solve the problem. Apart from that,
paging can occur when processes are created, and sometimes ADDM offers nothing about the root cause,
so presumably no action is required.
Conclusion
The clusterware is the backbone of having all servers in the configuration work in conjunction with each other.
The efficiency and functioning of the clusterware is important. This chapter discusses the various diagnosis options
available. While the clusterware consists of more than just the various daemons covered here, we leave other
components, such as the interconnect and storage, to be discussed in their respective chapters.
Search WWH ::

Custom Search