Database Reference
In-Depth Information
The average values in Figure
6-6
are also based on statistic values from
GV$SYSSTAT
and
GV$DLM_MISC
views.
Once the actual values are computed, the average is determined to provide an overall health of the cluster during the
snapshot interval. Table
6-3
illustrates the statistic values used in some of the average workload characteristics listed
in Figure
6-6
.
Table 6-3.
AWR - RAC- Global Cache Load Profile Formula
Statistic
Formula
Goal (ms)
10 *
gc cr block receive time
/
gc cr blocks received
Average Global Cache CR Block
Receive Time
1
10*
gc current block receive time
/
gc current blocks received
Average Global Cache Current
Block Receive Time
1
AWR
Formula
provides other RAC-related performance statistics in the AWR report, such as
•
RAC Report Summary
•
Global Enqueue Statistics
•
Global CR Served Stats
•
Global CURRENT Served Statistics
•
Global Cache Transfer Stats
•
Global Cache Transfer Statistics aggregated per class
Among these the Global Cache Transfer Statistics is an informative section providing details of block transfers
between various instances participating in the cluster. As illustrated in Figure
6-7
, the transfer is broken
down between CR and Current requests.
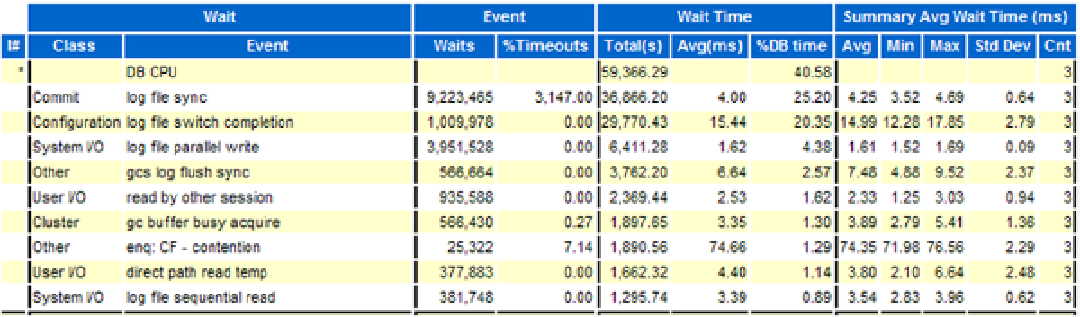
As mentioned earlier, in a RAC environment, a summary report can be generated using the script
$ORACLE_HOME/rdbms/admin/awrgrpt.sql
. This script will provide a consolidated summary of the RAC cluster
grouping the report into sections. Figure
6-8
illustrates the top timed events across the various nodes in the cluster.
Figure 6-8.
AWR - Cluster Top Timed Events Summary
Similar to the Top Timed wait events illustrated in Figure
6-8
, the AWR reports several summaries of areas that
would otherwise have to be retrieved by generating individual reports from each instance in the cluster.


Search WWH ::

Custom Search