Database Reference
In-Depth Information
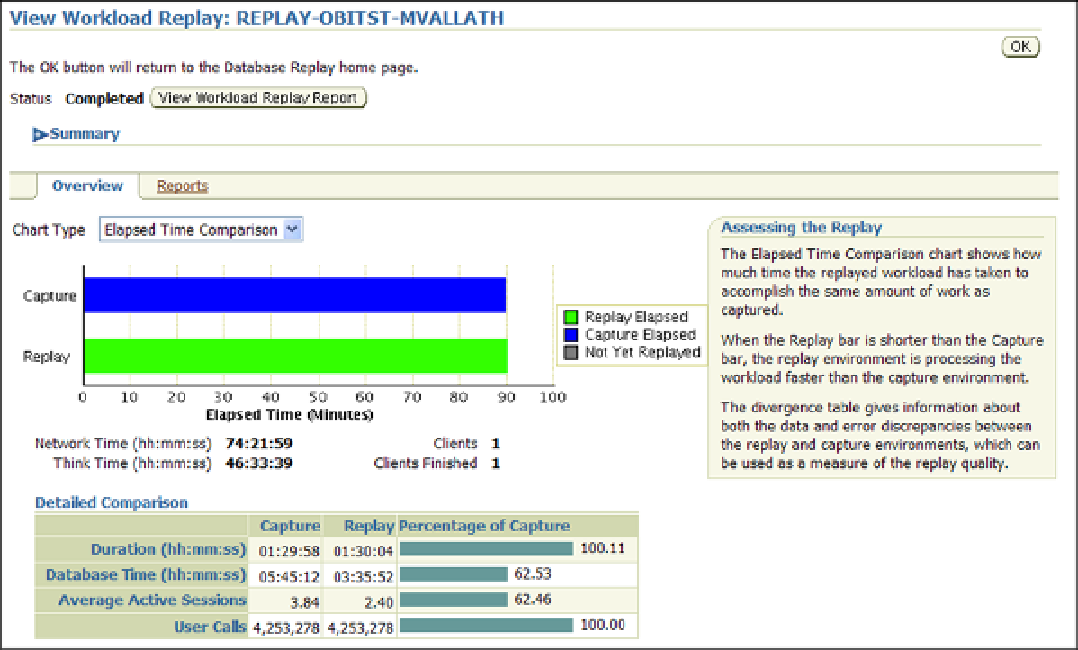
Figure 5-20.
OEM—Workload Replay status
Apart from the summary illustrated in Figure
5-20
, OEM also provides an analysis report. This can be obtained
by selecting the Reports tab from the Summary screen that compares the capture and replay. It compares the AWR
statistics between the capture and replay.
Step 22
Once a baseline comparison between the current production and the new production or test environment is
completed, it's good practice to repeat the Workload Replay section (Steps 15 through 18) by adding one node at a
time and comparing the results after every run with the previous baseline and with the capture baseline. Figure
5-21
illustrates the workload replay in a clustered environment. As one notices from the output, the replay time has increased
significantly compared to the results illustrated in Step 21 with Figure
5-20
.
Search WWH ::

Custom Search