Biology Reference
In-Depth Information
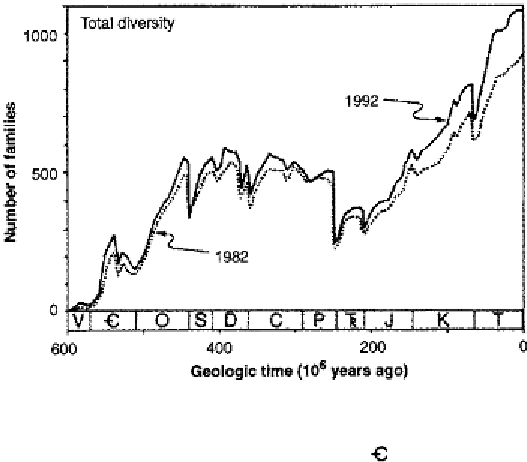
Figure 6.1. Fossil record of marine diversity (data from 1982 dotted line, data
from 1992 uninterrupted line). Note several mass extinctions, Paleozoic plateau
and post-Paleozoic rise in diversity. V - Vendian, - Cambrian, O - Ordovician,
S - Silurian, D - Devonian,
C
- Carboniferous, P - Permian, - Triassic, J - Jurassic,
K - Cretaceous, T - Tertiary. Recent studies have not led to a significant change of
trends, suggesting that the records indicating a continuing increase in diversity are
sound. From Jablonski (
1999
). Reprinted by permission of the author and the
American Association for the Advancement of Science.
Those increases that did occur were restricted to short periods; for periods
of tens of millions of years diversity changed very little. For example,
diversity of Ordovician invertebrate muddy benthos remained more or
less stable over five million years, when correction is made using ''closed-
model jack knife estimates'' (for details see Rosenzweig) (Figure
6.3
). But
this stability was dynamic, species became extinct and were replaced by
others. Likewise, North American large mammals retained their diversity
over much of the Cenozoic.
A repeated decrease in diversity due to mass extinctions is well docu-
mented (see above and Jablonski
1991
), and the removal of provincial
barriers has also reduced diversity, although less dramatically, at least for
higher taxa. Thus, before South and North America joined, the total
number of mammalian families was 50 (25 families in North America, 23
in South America, and 2 in both continents), whereas it is now 38
(8 endemic northern, 15 endemic southern, and 15 shared families)
(Flessa
1975
). There have also been periods of prolonged stasis, as already