Information Technology Reference
In-Depth Information
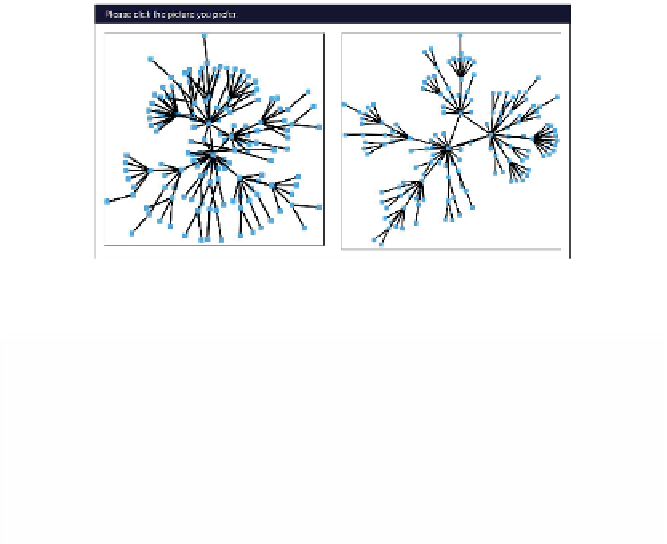
Fig. 1.
Example of a typical“instance” (agraph pair shown to participants)
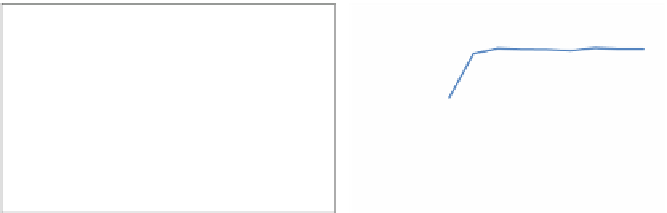
Stress ratio vs preference %
Crossings ratio vs preference %
80
80
75
75
70
70
65
65
60
60
55
55
50
1
1.5
2
2.5
3
3.5
4
4.5
5
50
Crossing ratio: higher crossings / lower
crossings
1
1.5
2
2.5
3
3.5
4
4.5
5
Stress ratio: higher stress / lower stress
Fig. 2.
Stress ratios, crossing ratios, and preferences
decreases when the stress ratio is between 4 and 5. Further, the user's preference for
lower crossings increases from crossing ratio 1 to 1.5, where
crossing ratio
is the ratio
of the crossings between the two drawings presented to the user. For 76% of instances
where the crossing ratiowasatleast2,thehuman preferred the drawing with fewer
crossings. The relationships between stress ratios, crossing ratios, and preferences are
illustratedinFig.2.
Remarks.
Ourresults suggest that people prefer less stress; further, this effect increases
as the stress decreases. A similar result can be inferred for crossings. However, this
initial experiment raises a number of questions: In particular, crossings and stress are
weakly correlated in our data set, in that graphs with higher stress tend to have more
crossings. It is unclear whether the preference is for less stress or less crossings(or
both).
Our experimental software is web-deployable. We welcome more researchers to
collaborate in this project.
References
[1] Purchase, H.C.: Which aesthetic has the greatest effect on human understanding?In:DiBat-
tista, G. (ed.) GD 1997. LNCS, vol. 1353, pp. 248-261. Springer, Heidelberg (1997)