Information Technology Reference
In-Depth Information
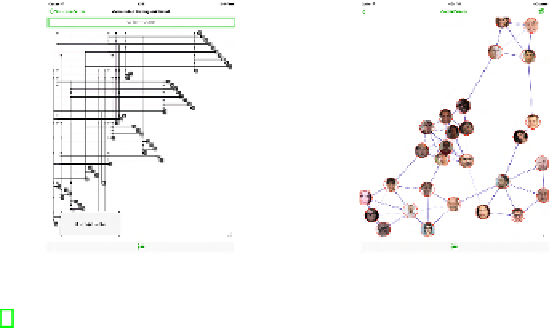
Fig. 1.
Two screenshots of the GraphBook system. Left: The input is an overloaded orthogonal
drawing [4]ofaDBLP coauthorship network and the displayed page shows the paths of length
one in the network. Right: The inputisastraight-line drawing of a social network and the read-
ability property used to compute the displayed page is planarity (see also [2]).
the difficulty of making sense of a distributed information, thus it is important to have
as few pages as possible. If
ʓ
R
is straight-line, then a user could prefer to see each
page
p
i
withoutanyedge crossing, i.e., as planar, or that any two crossing edges form a
sufficiently largeangle. Computing a minimum set of pages that cover all the edges of
G
and such that each page guarantees a prescribed readability property can be heuristically
computed in polynomial time [2]. If
ʓ
R
is an OOD, a natural choice to build the set of
pages is to assigntopage
p
i
all edges that represent shortest paths of length
i
.
Binding.
Binding all the pages together is done by a set of interactive operations that
can be usedtobrowsethepages of the topic and to explore a single page. To go from one
page to the next one or to the previous one, it is enough to swipe the screen from left to
right or from right to left, respectively: The edges in the current page will fade out, while
the edges in the new page will fade in. Zooming in and out is done by the pinch and
stretch gesture. The edges incident on a vertex, even those assigned to different pages,
can be highlighted by tapping on the vertex. If tapping on two vertices the system shows
the edge that connects the two vertices (if any). By selecting aregion of the screen with
acirclegesture the subdrawing induced by the vertices inside the region is highlighted.
References
1. Da Lozzo, G., Di Battista, G., Ingrassia, F.: Drawinggraphs on a smartphone. JGAA 16(1),
109-126 (2012)
2. Di Giacomo, E., Didimo, W., Liotta, G., Montecchiani, F., Tollis, I.G.: Techniques for edge
stratification of complex graph drawings. JVLC 25(4), 533-543 (2014)
3. Eades, P.A.: A heuristic for graph drawing.In:Congr. Num., vol. 42, pp. 149-160 (1984)
4. Kornaropoulos, E.M., Tollis, I.G.: Overloaded orthogonal drawings. In: van Kreveld, M.J.,
Speckmann, B. (eds.) GD 2011. LNCS, vol. 7034, pp. 242-253. Springer, Heidelberg (2011)
5. Wu,Y.,Liu,X.,Liu, S., Ma, K.-L.: Visizer: A visualization resizing framework. IEEE
TVCG 19(2), 278-290 (2013)