Environmental Engineering Reference
In-Depth Information
5
R = 0.1
R = -1
R = 10
4
3
2
1
0
1
10
100
1000 10000
Number of cycles
100000 1e+06
1e+07
1e+0
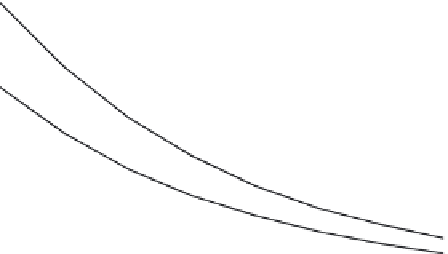
FIGURE 5.7
The.Wohler.diagram.showing.50.percent.regression.lines.based.on.data.from.the.OPTIMAL.
database.
TABLE 5.3
Fatigue.Compression.Strength.Prediction.for.Graphite/Epoxy.Composites
Fatigue
Strength
MPa/psi
σ
s*
10
-3
MPa/psi
σ
m*
10
-3
MPa/psi
S
j*
10
-3
MPa/psi
Parameter
t
Φ
(t)
σ
-1*
10
-3
P(t)
.37/54
.412
.3668
.6332
.24/34.2
.36/52
.24
.3885
.6115.
.22/31.8
.34/50
.34/49.16
.024/3.46
.07
.3980
.6000.
.20/30.0
.33/48
.009
.3989
.6010.
.198/28.8
.32/46
.025
.3876
.6124.
.19/28.17
.31/45
.035
.3765
.6235.
.19/28.05
TABLE 5.4
Density.of.Probability.Function.(First.Approach)
t
0
1
2
3
4
5
6
7
8
9
0,0
3989
-4
3989
3989
3988
3986
3985
3998
3980
3977
3973
0,1
3970
-4
3965
3961
3956
3951
3945
3939
3932
3925
3918
0,2
3910
-4
3902
3894
3885
3876
3867
3857
3847
3836
3825
0,3
3814
-4
3802
3790
3778
3765
3752
3739
3726
3711
3697
0,4
3683
-4
3668
3653
3637
3621
3605
3589
3572
3555
3538
0,5
3521
-4
3503
3485
3467
3448
3429
3410
3391
3372
3352
0,6
3332
-4
3312
3292
3271
3251
3230
3209
3187
3166
3144


Search WWH ::

Custom Search